Chainlink’s Bullish Surge: LINK Breaks Key EMA Resistance, Eyes $30 Target

Chainlink shatters through critical resistance levels as bullish momentum builds—traders are positioning for the next leg up.
Technical Breakout Confirmed
LINK isn't just holding above key EMAs—it's dominating them. The move signals strong institutional accumulation while retail traders scramble to catch up. This isn't mere speculation; it's a calculated breach of resistance that even traditional finance analysts can't ignore.
Market Sentiment Shifts
With the $30 target now in sight, the crypto community watches as Chainlink demonstrates why oracle networks remain fundamental to DeFi's infrastructure. Meanwhile, Wall Street still tries to figure out whether blockchain is a stock or a bond—classic.
Next Resistance Levels
If momentum holds, expect a test of the $30 psychological barrier. Breaking that could open the path toward new yearly highs. For now, the charts aren't just talking—they're shouting.

- Chainlink trades at $23.27 after an 8% weekly decline but remains in a long-term uptrend.
- Technical signals point to possible gains toward $27–$32 if resistance levels are cleared.
- A close below $19.7–$18.3 could shift momentum back to a corrective phase.
Chainlink has seen renewed volatility after a 3% daily drop and an 8% decline over the week, with the token now priced at $23.27. Despite the recent weakness, the structure on higher timeframes remains supportive of a bullish outlook.
Market watchers believe that LINK is still above its 20, 50, 100, and 200-week exponential moving averages, currently at $19.7, $17.6, $15.9, and $13.8. This is interpreted as a very bullish sign of an established uptrend.
LINK has been oscillating in a huge trading range in the recent months, holding support in the high-teens while facing sell pressure below the upper-$20 area.
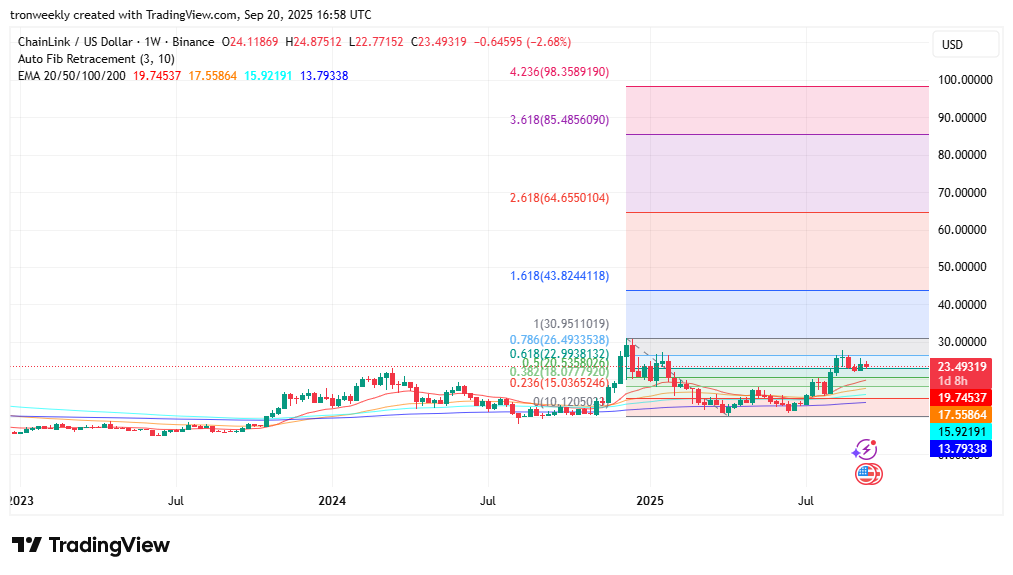
The recent upmove is still keeping the price in the top half of the range, setting it up for yet another retest of resistance areas.
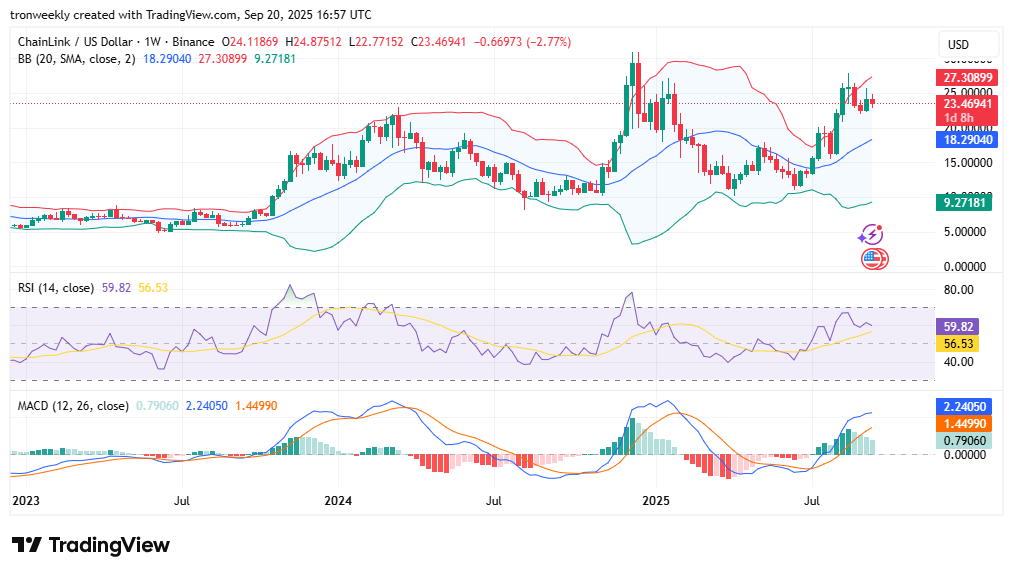
Chainlink Trades Near Upper Bollinger Band at $27.28
Momentum indicators remain bullish. The RSI is at 59, nicely in the bullish range of 50–70, and still with upside room before entering overbought territory.
The MACD indicator is sloping up again, and the line and histogram are positive, signaling new strength.
The Bollinger Bands also reveal the current setup, as LINK is ranging around the top band at $27.28, with the mid-point being $18.28.
That WOULD put the token trading the top band into the high-$20s if buying pressure continues. However, any loss of momentum may trigger a reversion back into the $18 zone.
Key Resistance Levels: $24.9–$25 and $27–$27.5
The next zone of resistance is between $24.9 and $25.0, and thereafter is a stronger zone at $27.0–$27.5.
A close on a weekly basis above $25 would probably open up a retest of the higher end, while a proven breakout through $27.5 might shift the market from a range-bound into a trending phase.
Breakout targets for such an occurrence go as high as $30–$32 and even into the mid-$30s.
Conversely, near-term support is at $22.0–$22.5, with the 20-week EMA at $19.7 and the base of the Bollinger Band at $18.3 offering additional cushioning. A drop below $17.5 would negate the larger-picture bullish argument and expose lower supports in the $16–$15.5 range.
Chainlink’s long-term technical analysis is positive, although the immediate next couple of weeks will be crucial in deciding if it transitions from consolidation into a new uptrend.
