Shiba Inu (SHIB) Price Prediction: Analysts Eye Potential Breakout Amid Market Volatility

Shiba Inu teeters on the edge of a major price surge as market analysts spot bullish patterns forming. The meme coin that defied all conventional wisdom now stares down another potential breakout opportunity.
Market Momentum Builds
Volatility shakes the crypto markets, but SHIB holders remain unfazed. Trading patterns suggest accumulating pressure that could trigger significant upward movement. Technical indicators align with previous breakout scenarios that sent prices soaring.
Analysts Watch Key Levels
Professional traders monitor critical resistance points that, if broken, could unleash another rally. The same analysts who once dismissed meme coins now scramble to update their models—because nothing says 'sound financial advice' like chasing internet dog money.
Market participants brace for what could become another chapter in SHIB's unpredictable journey. Whether this breakout materializes or fizzles out remains the million-dollar question—literally.

- Although the market is volatile, SHIB is holding all its support levels intact.
- The buying pressure for the coin is increasing. Traders mostly take this as a scenario to watch for upward momentum.
- The coin’s performance totally depends on the coin’s technical indicators, macroeconomic events, and social sentiment.
Analysts have been closely monitoring shiba inu (SHIB) as it appears to be on the verge of a possible bullish breakout. At press time, the coin is trading at $0.00001340 (6.75% ) at a volume of $280.35 million. The coin’s market cap is at $7.89 billion. Even though the market is volatile, SHIB is holding all its support levels intact.
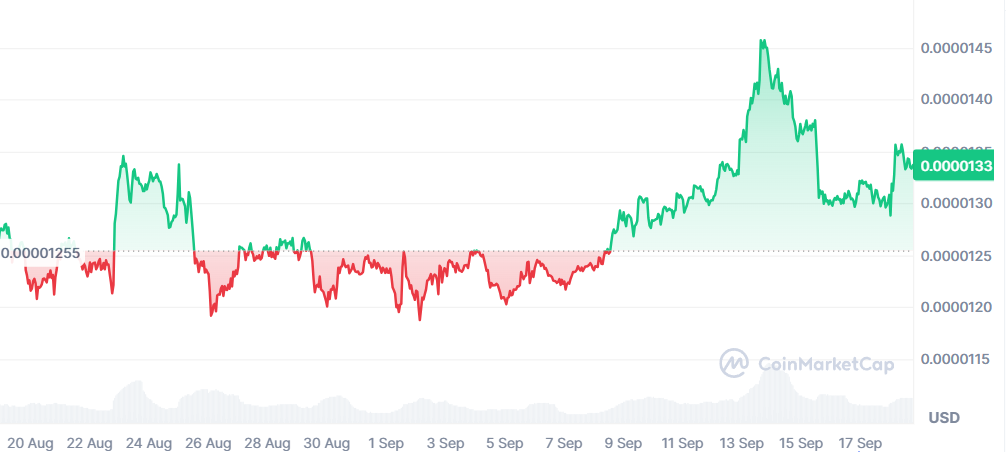
Chart Patterns Flashing Mixed Signals for Shiba Inu
According to the data provided by Trading View chart, the memecoin is experiencing resistance at (yellow) at $0.00001364 and support line (blue) at $0.0000129. The Moving Average indicator shows that the coin is experiencing a bearish scenario since the MA line is above the candlesticks.
The Moving Average Convergence Divergence indicator shows that the coin has a bullish momentum because the MACD line (blue) is above the signal line (orange). This signifies that the buying pressure is increasing. Traders mostly take this as a scenario to watch for upward momentum.
Price Targets in Sight
According to the data given by CoinCodex, September will probably have an average price of $ 0.00001387 and a maximum price of $ 0.00001563. The month might have a Potential ROI of 16.31%.
Huge whales are reportedly collecting SHIB, making it open to sudden sentimental shifts. In total, this says that the SHIB is in a pre-breakout state. Technical indicators, and hold in support levels, and whale accumulation all suggest a positive outlook.

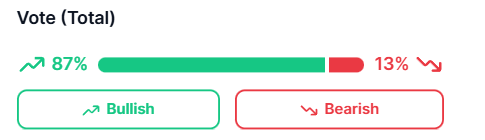
The data given by CoinMarketCap indicates that 87% of the traders believe in a bullish momentum. The rest 13% doubt a bearish momentum. Analysts are keen on the coin’s future momentum, and that will totally depend on the coin’s technical indicators, macroeconomic events, and social sentiment.