Stader Targets $1.12 Milestone as Trading Volume Skyrockets to $112.8M

Stader's token surges toward a bullish target—while whales dump $112.8M into the frenzy. Is this the next moonshot or just another liquidity trap for retail bagholders?
Price action heats up as volume explodes. The protocol's aggressive $1.12 target now looks within reach—assuming the bulls don't get rekt by another 'institutional pullback' (read: VC dump).
Meanwhile, TradFi analysts still can't decide if crypto is a hedge against inflation or a leveraged bet on hopium. Place your bets.

- Stader volume surges 2200%, signaling speculative interest and potential price breakout.
- Key support at $0.63 holds, with the $1.12 VWAP zone eyed as resistance.
- Momentum indicators suggest cooling as traders await next move above VWAP cluster.
After its price ROSE to $1.50 before a sudden fall, Stader (SD) is beginning to generate traction. Market activity around it is starting to pick up. Derivatives volume in the past 24 hours was $112.8 million with an increase of over 2200%.
Even though Stader has experienced a sharp retrace, traders may concentrate on the major technical areas. These are zones where they can re-enter for short-term gains.
Stader Price Maintains $0.63 Support Level
According to The TradingView chart, the trading price is close to the 0.236 Fibonacci retracement level at the moment. This level corresponds to the $0.63 level. It is a crucial support zone after the bounce between $0.42 and $1.50.
In case of further decline, additional supports are at $0.59, and $0.52. These price levels correspond to the 0.382 and 0.618 retracement areas. Major resistances have been built between $1.07 and $1.12, which include the VWAP range for the session.
The next level to watch will be the VWAP cluster. A breach above that will imply that the bulls are getting back into control.

Fib. and VAWP. Source: TradingView
RSI and MACD Signal Cooling Momentum
Momentum indicators denote a cool down period following the parabolic move. RSI was at 69.28 just below overbought line, which indicated a diminishing interest in buying the cryptocurrency.
This fall points to a consolidation or a corrective period. The MACD lines are flat, indicating a pause in the upward trend.
Also, there isn’t a strong yet crossover. This implies that the price action can be either sideways or corrective unless buying momentum returns.
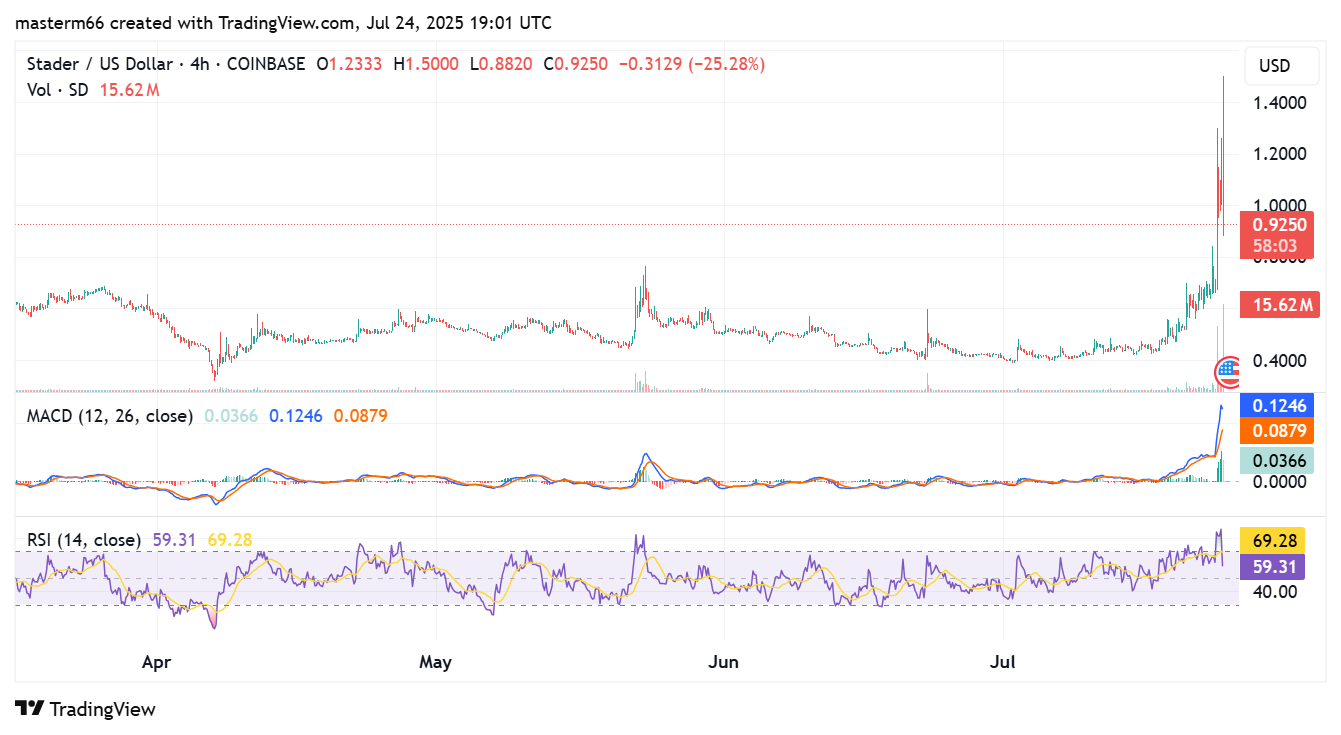
RSI and MACD. Source: TradingView
Rising Derivatives Suggest Stader Spike Is Speculative
The derivatives data from Coinglass indicates aggressive positioning based on the rally. The open interest increased by 236% to $2.8 million. This indicates that traders have taken massively Leveraged positions.
This rise in open interest is significant. Combined with the increase in volume to $112.8 million, it points at increased volatility and high speculative interest. Such activity levels may cause short-term trading opportunities due to significant price fluctuations.
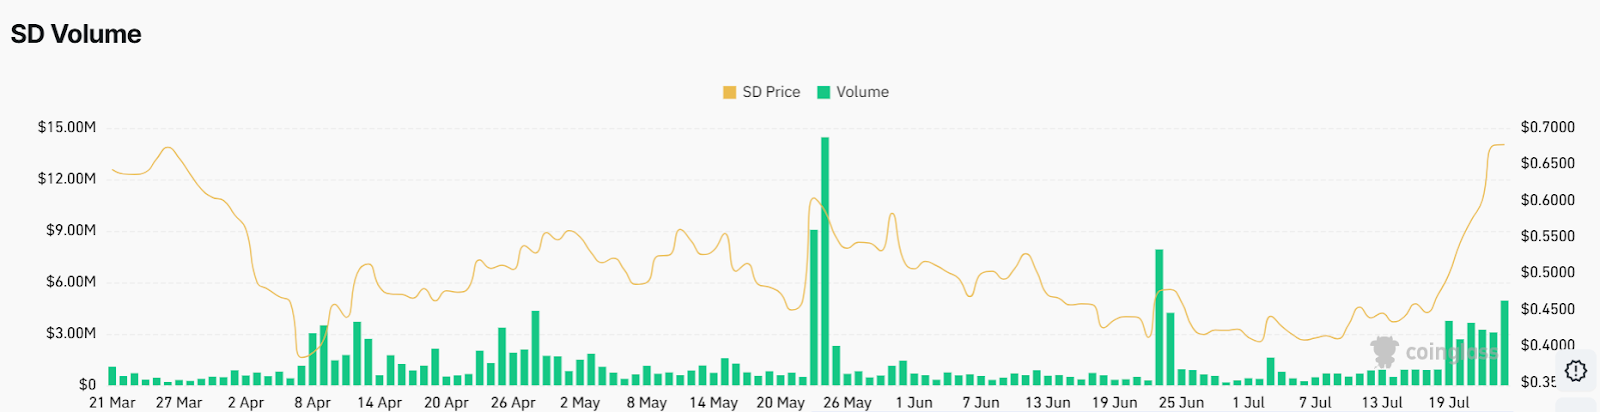
Source: Coinglass
The traders monitoring Stader can both enter and exit using important levels. When price bounces off the $0.63 Fibonacci zone, then a stop-loss just below $0.59 is recommended.
The profit can be established just above the VWAP resistance, which is between $1.0712 and $1.12. In case SD breaks out and remains higher than $1.12, trailing stop orders are set. These can be used to capture more upsides without compromising gains.
On the other hand, a drop below $0.59 indicates that more correction could happen. But the reentry price can be found at $0.52. The following sessions are going to be crucial in establishing the trend.
The reaction of Stader’s price above the VWAP region will be crucial. Likewise, a possible reset from momentum indicators to complete another leg higher.
