Bitcoin’s Secret Signal for Market Reversals—Is the Next Big Move Here?

Crypto's crystal ball is flashing again—and Bitcoin traders are leaning in.
The metric that called past tops and bottoms
One obscure on-chain indicator has a knack for nailing Bitcoin’s pivot points. Now it’s hinting at another potential regime shift—just as institutional money starts playing hot potato with BTC ETFs.
Wall Street’s late arrival to the party
While hedge funds finally ‘discover’ crypto (only three cycles late), the real action’s in the blockchain’s plumbing. Miners’ wallets, exchange flows, and dormant coins are whispering what price charts won’t say yet.
The cynical take
Of course, if this signal fails, some VC will just rebrand it as ‘quantitative hibernation’ and raise a $100M fund around it.
Bitcoin Short-Term Holder Balance Hasn’t Seen Any Major Shifts Recently
In a new post on X, institutional DeFi solutions provider Sentora (formerly IntoTheBlock) has shared a chart that shows how the holdings of the different bitcoin investor groups has changed over the years. The cohorts in question have been divided on the basis of holding time.
The analytics firm classifies investors into three groups: traders, cruisers, and hodlers. The traders include the holders who have been carrying their coins for less than a month. This group corresponds to the new entrants in the sector and the investors who participate in high frequency trades.
The cruisers are investors who are no longer that short-term minded, but they also haven’t built up enough resilience to be in it for the long-term yet. Cruisers who manage to hold past the one year mark become part of the diamond hands of the network: the hodlers.
Now, below is the chart for the net change in the supply held by these three Bitcoin groups.
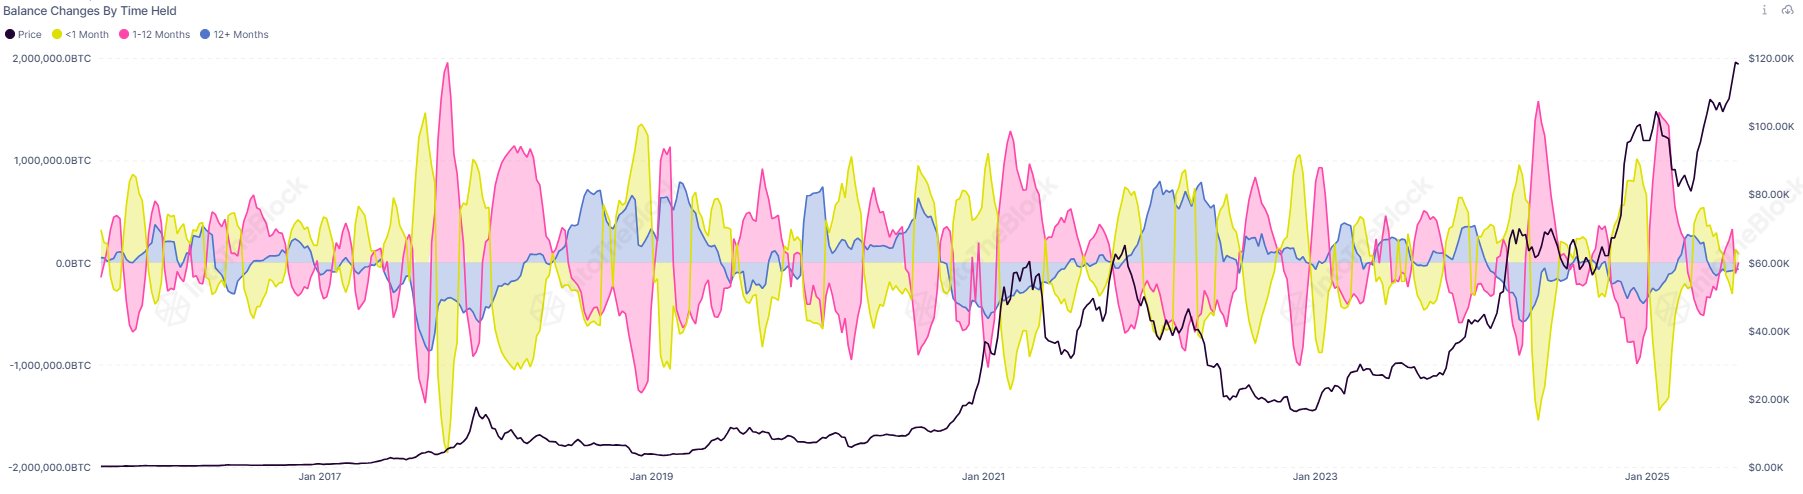
As displayed in the above graph, these cohorts have historically shown a certain pattern NEAR inflection points in the asset. “Fluctuations in short-term holder balances often signal market turning points,” notes the analytics firm.
During major tops and bottoms, the traders generally register a sharp spike in their balance, as cruisers and hodlers take part in profit realization or capitulation. Whenever these older groups sell, the age of their coins resets back to zero and they are put into the supply of the traders.
From the chart, it’s apparent that while Bitcoin has observed a sharp rally to new all-time highs (ATHs) recently, there still hasn’t been any big changes in the supplies of the traders. “Interestingly, we’re not seeing major shifts at the moment,” says Sentora. It now remains to be seen whether this means that the current rally still has room to grow.
In some other news, the cryptocurrency has seen an uptick in on-chain transaction activity, as the analytics firm has pointed out in another X post.
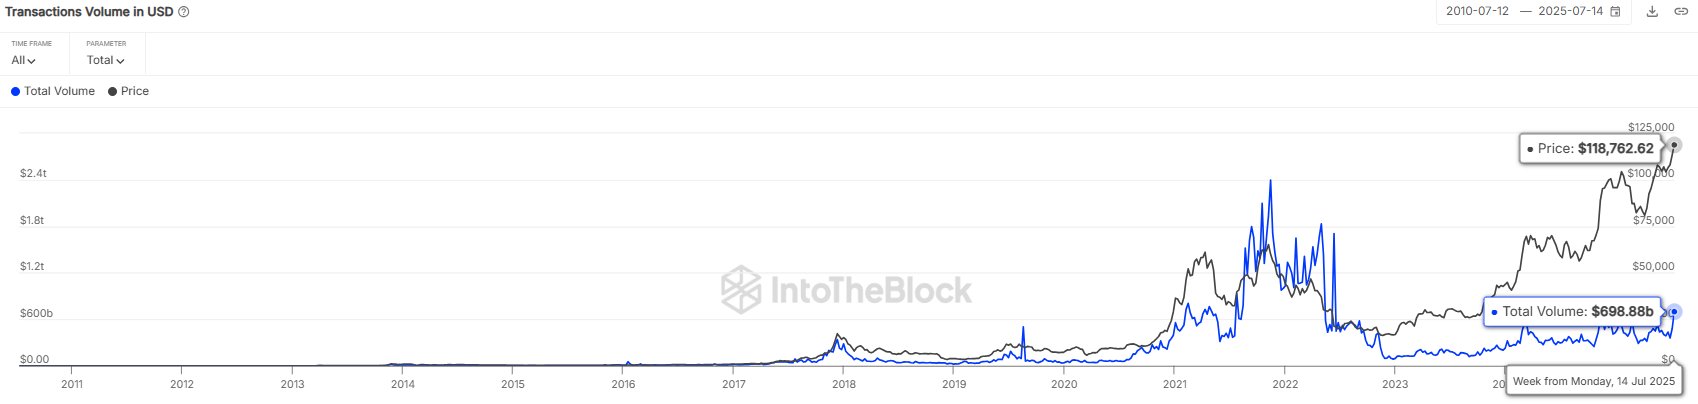
The weekly Bitcoin transaction volume reached almost $700 billion last week, the highest level since 2022. Though, while this does indicate activity is as high as it’s ever been in this cycle, it’s still muted when compared to the highs of the 2021 bull run.
BTC Price
Bitcoin is still stuck in sideways movement as its price is trading around $119,000.
