PEPE Defies Market Chill: Can the Memecoin Keep Rallying in 2025?

While blue-chip cryptos wobble, PEPE's chart stays suspiciously green—defying gravity like a frog on espresso.
The meme that wouldn't die
Retail traders pile in as 'smart money' scoffs, proving once again that in crypto, fundamentals are just decorations on a slot machine.
Liquidity or lunacy?
With trading volumes outpacing half the top 50 coins, PEPE's either the next DOGE or the ultimate bagholder trap. Place your bets before the music stops—Wall Street's watching, and they brought scissors.

- PEPE remains above key EMAs, signaling bullish trend continuation.
- MACD and RSI show weakening momentum but no strong reversal.
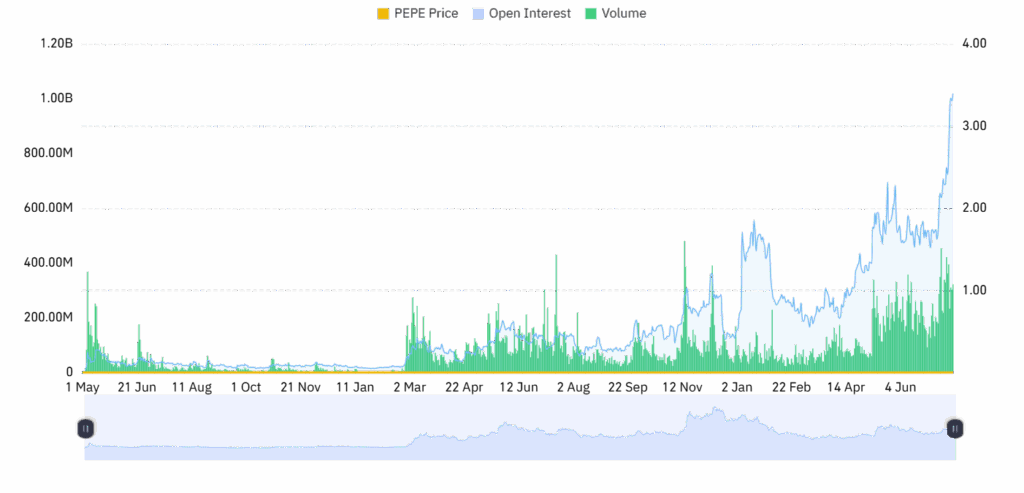
- Open interest declines, suggesting short-term caution toward the $0.00002 target.
Pepe (PEPE) continues on a broad positive track even though the current crypto environment has turned more neutral. While the meme token has fallen by almost 5.04% over the past 24-hour period, the general weekly performance hints at stability in the background.
At the time of writing, the price of Pepe stands at $0.00001313 with a 24-hour volume of $1.35 billion after dipping by over 1.35% in the same period.
Its market cap stands at a steadfast $5.52 billion, making the token one of the most prominent meme coins in the cycle.

Pepe Price Action Signals Bullish Consolidation Phase
Technically, the token is at a critical stage. On the daily chart, the token recently touched the upper Bollinger Band but has retraced by 7.16%, which means it lost bullish momentum in the area of the short-term resistance zone.
Nevertheless, the token continues above all the essential exponential moving averages (20, 50, 100, and 200 EMA), which confirms the overall uptrend.
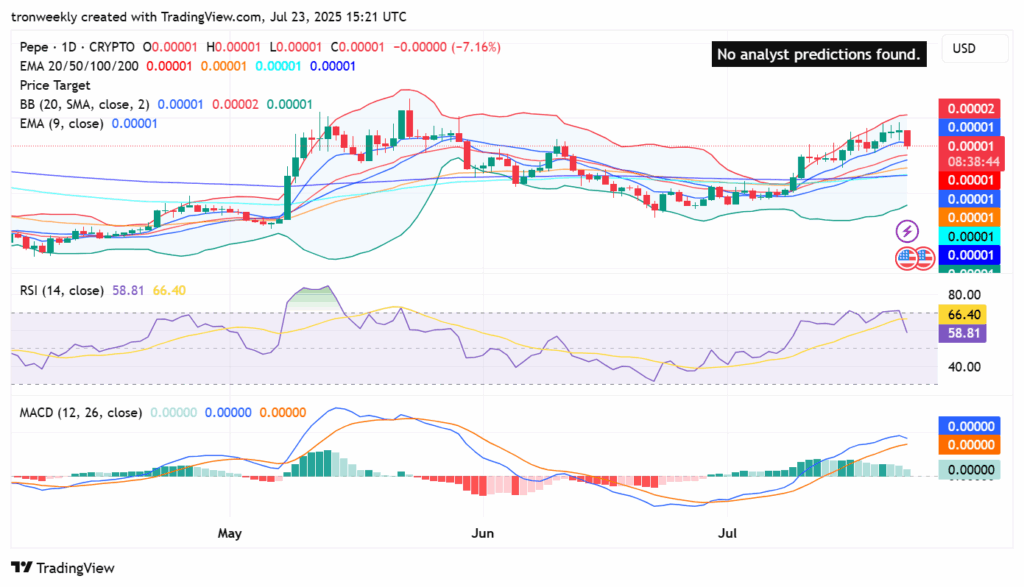
The Relative Strength Index (RSI) has cooled off to 58.81 from near-overbought positions of 66.40, suggesting the release of buying pressure. Although the RSI is still above the neutral zone, there is still potential for subsequent upward mobility.
The MACD continues the bullish momentum warning as the MACD line maintains its position above the signal line, though one should look out for the possibility of a flattening out, which may indicate short-run consolidation in the offing.
Open Interest and Volume Indicate Cooling Market Sentiment
On the derivatives side, the next chart reveals a mild increase in Open Interest (OI) weighted values at 0.0225%, suggesting a trader anticipation for larger directional changes.
Occasional spikes in the OI chart, though, are a sign of a highly speculative market condition in the short term, which will lead to volatile price movement.

On the macro front, open interest dropped by 9.48% to $894.28 million, while trading volume also declined by 20.04% to $2.94 billion.
The fall indicates a transient cool-off in enthusiasm for buying after the latest upswings, but the longer-term rising trend in OI suggests the sentiment is cautiously positive in the longer term.
What’s Next for PEPE?
If the current pullback intensifies, PEPE might go back through support areas NEAR the mid-Bollinger Band or the 50 EMA.
On the other hand, a bullish breakout may be triggered by a strong reversal back above recent highs and propel the price up towards the $0.00002 threshold or even beyond.
Investors will look for the RSI breaking below 50 and the MACD for indications that the trend is weakening. With tapering volume and OI, the next price movement in the token should be taken with a patient and disciplined attitude.
