Bitcoin Holds Below $123K: Brace for a Correction or Buy the Dip?

Bitcoin's bull run hits a wall—stalled under $123K as traders eye the charts for clues. Is this the calm before another leg up, or are we staring down the barrel of a major pullback?
Market psychology at play
Every ATH breathes greed into the market—until it doesn't. The king of crypto's sideways dance below six figures has analysts split between 'healthy consolidation' and 'impending doom.' Meanwhile, leverage rats keep stacking positions like Wall Street in 2007.
Technical crossroads
Support levels hold... for now. But with institutional money playing hot potato and retail FOMO at DEFCON 2, this could go full 'buy the rumor, sell the news.' Remember kids: corrections aren't crashes—unless you're overleveraged.
Closing thought: The only thing predictable about crypto markets? Bankers will blame 'speculative excess' right before launching their own ETF.

- Bitcoin drops to $118K with a 1.69% dip, but trading volume surges 49.9% to reach $74.98 billion.
- BTC fails to surpass the $123K Alpha Price level, signaling strong resistance and profit-taking pressure.
- Analysts expect BTC to consolidate below resistance before targeting the $143K–$146K price range.
As of press time, Bitcoin is currently trading at $118,323 with a decrease of 1.69% within the last 24 hours. The trading volume for the same period stands at $74.98 billion, reflecting a 49.9% increase. In spite of this, Bitcoin recorded an increase of just 0.47% in the past seven days. The market is experiencing high resistance at the level of the market of $123,000.
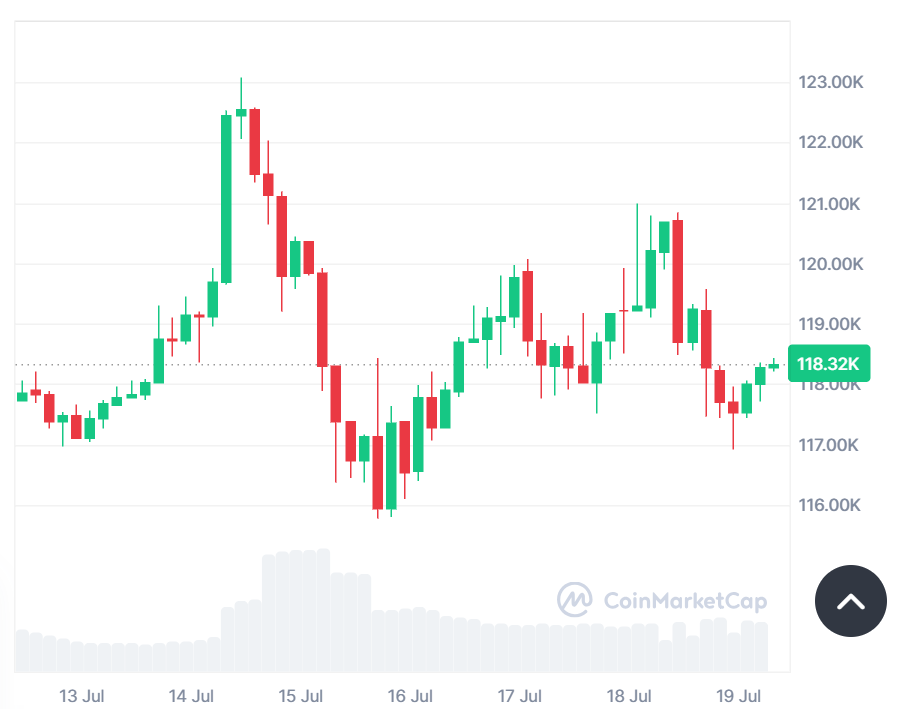
Source: CoinMarketCap
Analyst Joao Wedson highlighted the downside failure to take out the second Alpha Price level. The current dynamic threshold is at 123,370 dollars. It gets updated on a daily basis through on-chain transactions. bitcoin has tried breaching this level but has not been successful.
Bitcoin Price Thresholds
Alpha Price is an on-chain indicator applied to determine support and resistance. It begins with calculating the age of the market in days. Then it constructs a valuation model using realized cap and average cap. The outcome is a series of price ranges reflecting prior investor behaviour.
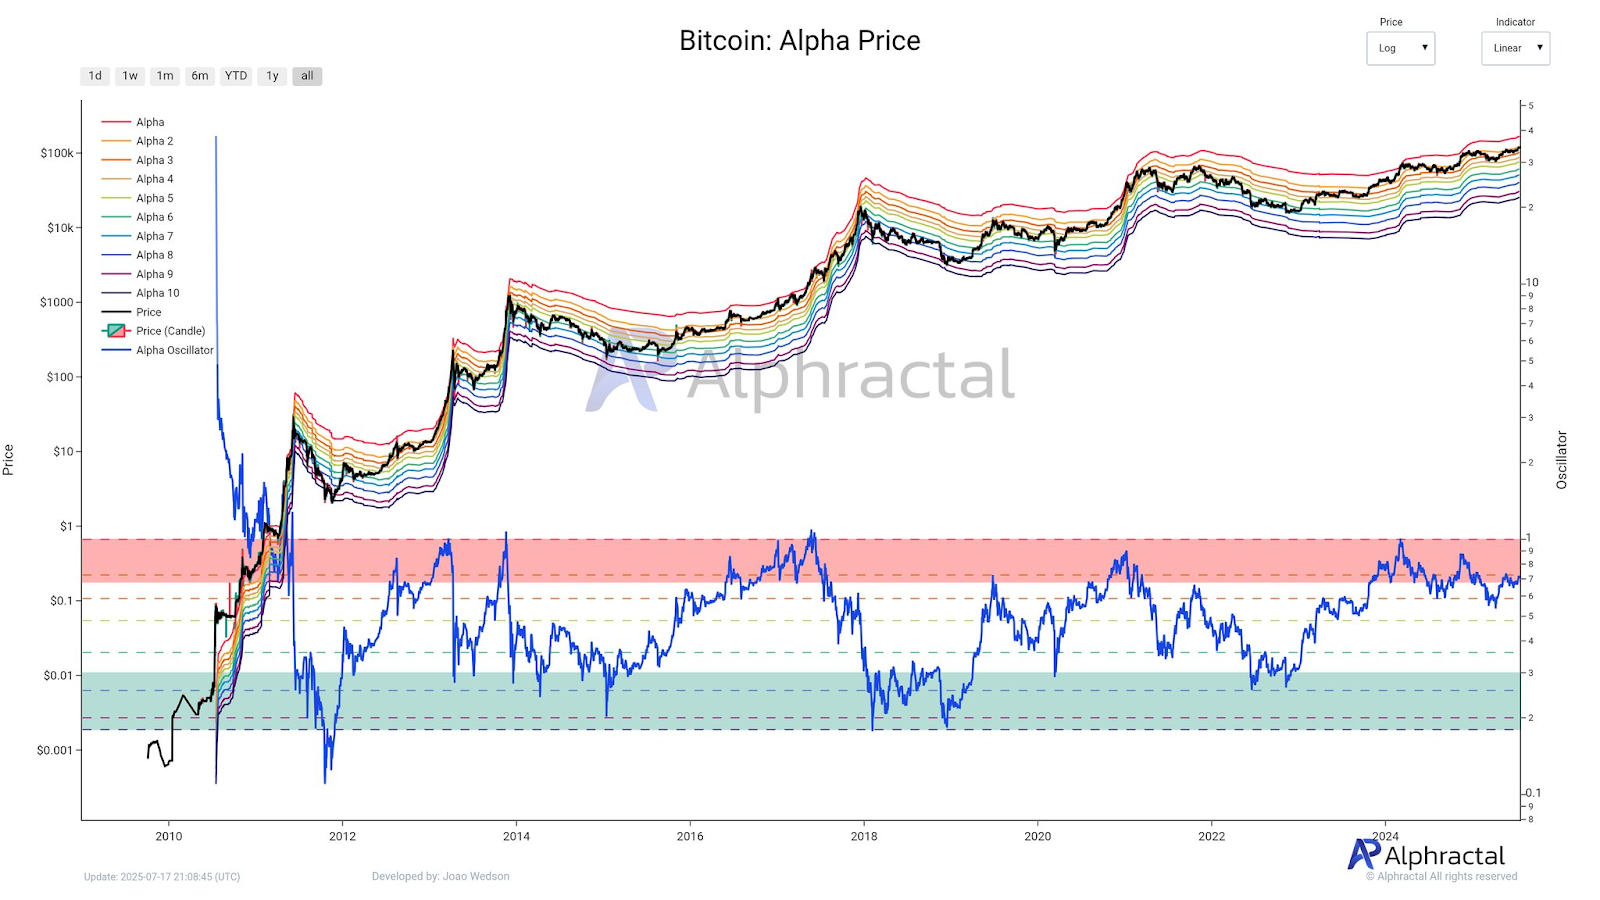
Source: X
During corrections, there is good support from lower alpha levels. When wallets are profitable, upper levels serve as resistance. The second Alpha level is an important resistance in the recent trend. The failure of Bitcoin to breach this level is an indication of strong selling.
There are a large number of holders who are profitable and potentially selling out. That restrains the upside and undermines the buying impulse.
Wedson says that there might be a temporary retreat. Bitcoin might be required to consolidate under the resistance region. This break might turn sentiment and bring in new buyers.
If the price moves beyond $123,370, the second target WOULD be between $143,000 and $146,000. This would be an important step and would provoke the third threshold of Alpha.
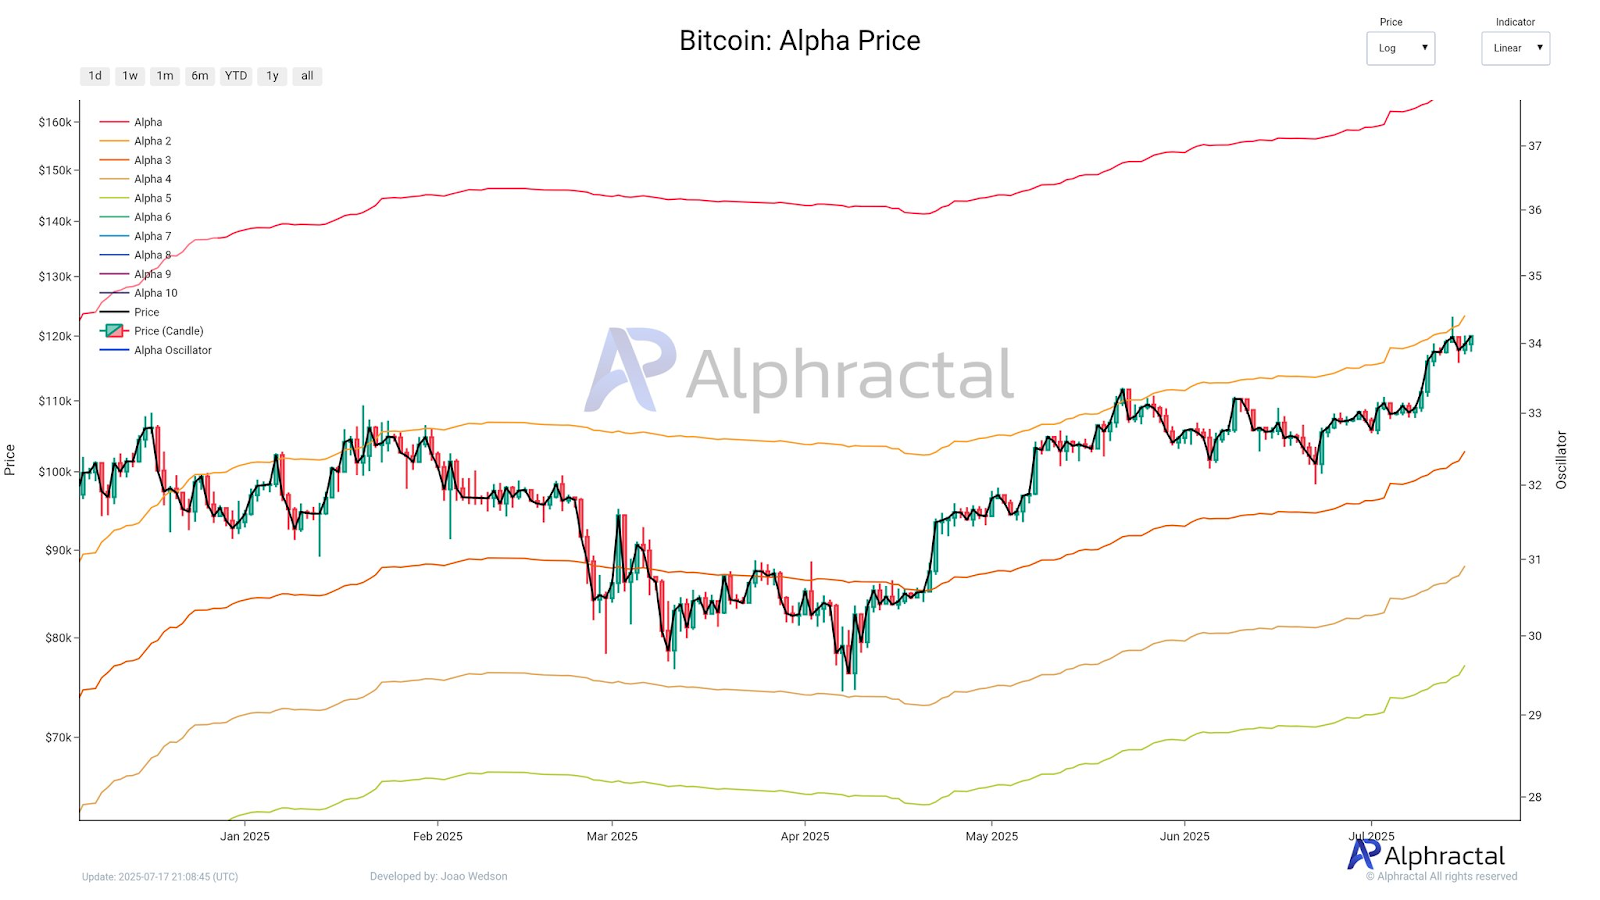
Source: X
Market Momentum Weakens
CoinGlass data shows a decline in the market momentum. The volume of trading decreased by 14.60% to $94.36 billion. The open interest declined by 2.24% to reach a figure of 85.74 billion. The OI-weighted funding rate is 0.0108%, expressing a neutral position in the derivatives market.
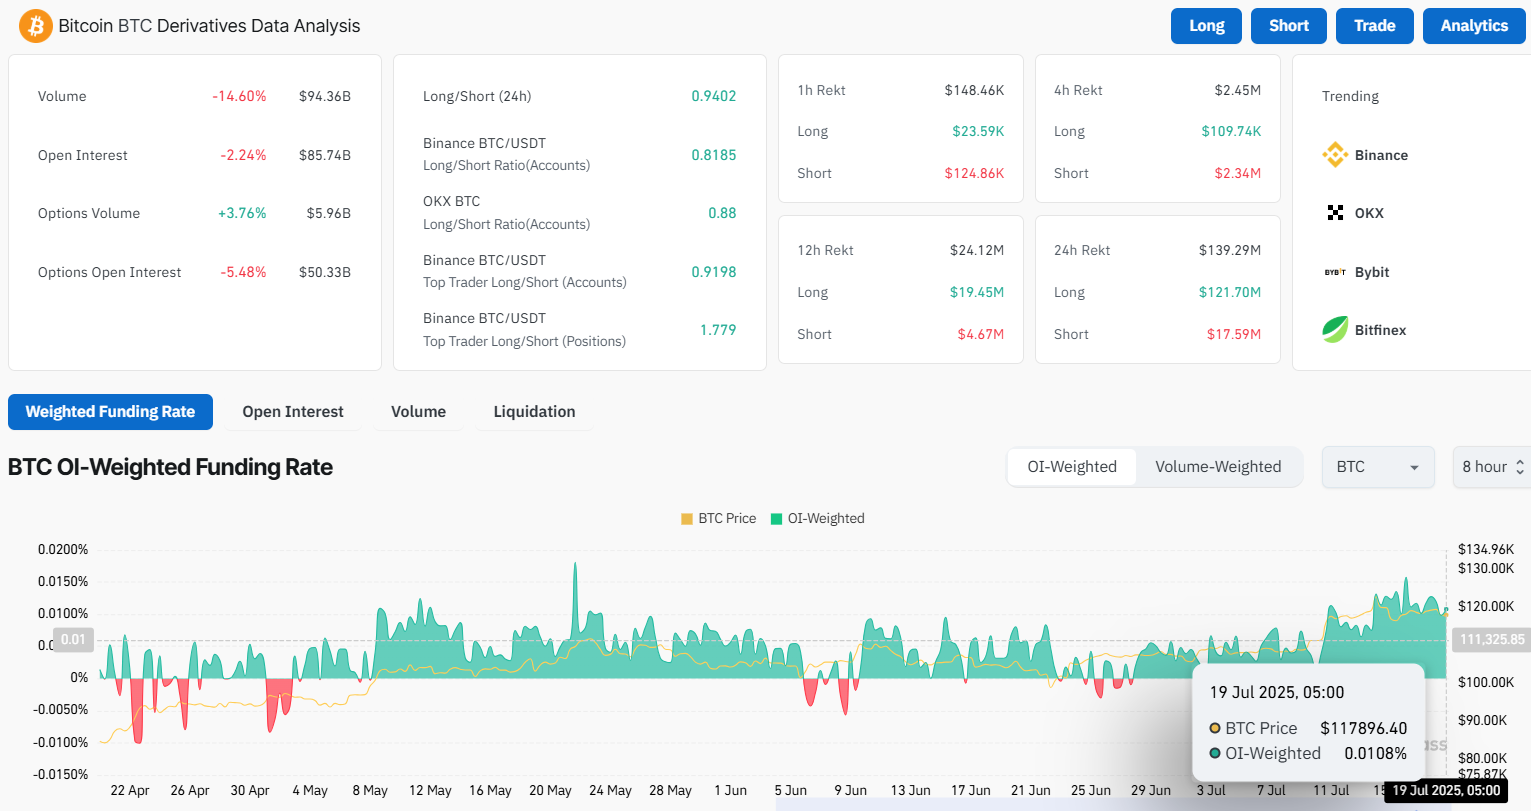
Source: CoinGlass
These statistics prove that traders are reluctant. Both the high resistance and low leverage activity show a warning signal. The Alpha Price levels remain the guiding prices in the market. The level of resistance at $123,000 is holding strong.
When Bitcoin surpasses this mark, it will be able to sustain the uptrend. Until then, the market can MOVE sideways or down. Traders wait eagerly to confirm. A decisive breakout would change the mood. A rejection might be a prelude to greater retraction or extending consolidation.
