BTCC
/
BTCC Square
/
Thecryptobasic
/
Bitcoin Primed for $150K Surge as Inverse Head and Shoulders Breakout Meets Key Fibonacci Target
Bitcoin Primed for $150K Surge as Inverse Head and Shoulders Breakout Meets Key Fibonacci Target

5
1
Bitcoin's chart just flashed its most bullish signal in years—and the math backs it up. A textbook inverse head-and-shoulders breakout coincides perfectly with the $150K Fibonacci extension level, setting the stage for a potential mega-rally.
Why technical traders are losing sleep
The pattern's neckline breach confirms accumulation by whales, while the 1.618 Fib extension—derived from Bitcoin's 2023-2024 range—provides a near-identical price target. Even Wall Street analysts can't ignore the symmetry.
Of course, some hedge fund managers will still claim they 'saw it coming' after the fact—right between sips of their $28 oat milk lattes.
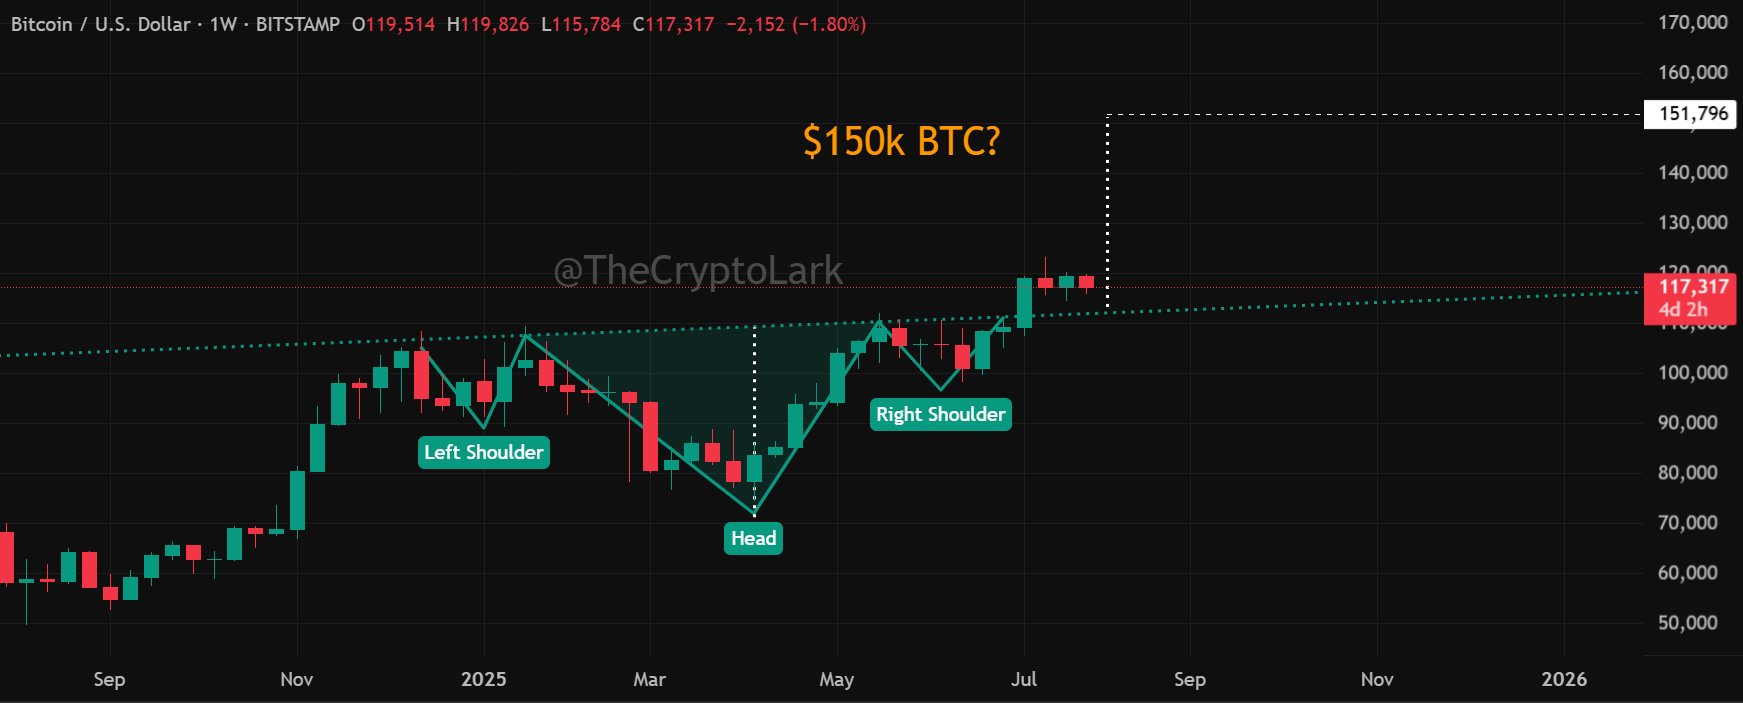 Bitcoin Inverse head and ShouldersBitcoin Inverse Head and Shoulders
Bitcoin's current price is $118,024, a 0.4% rise in the past day, increasing its monthly gain to 10% amidst recent volatility. bitcoin reached a weekly high of $119,826 on July 27 after retracing from the all-time high above $123,000 recorded on July 14.
Notably, the current pattern suggests a measured move upward that supports a long-term price objective of over $150,000, assuming momentum continues, and price holds above the neckline.
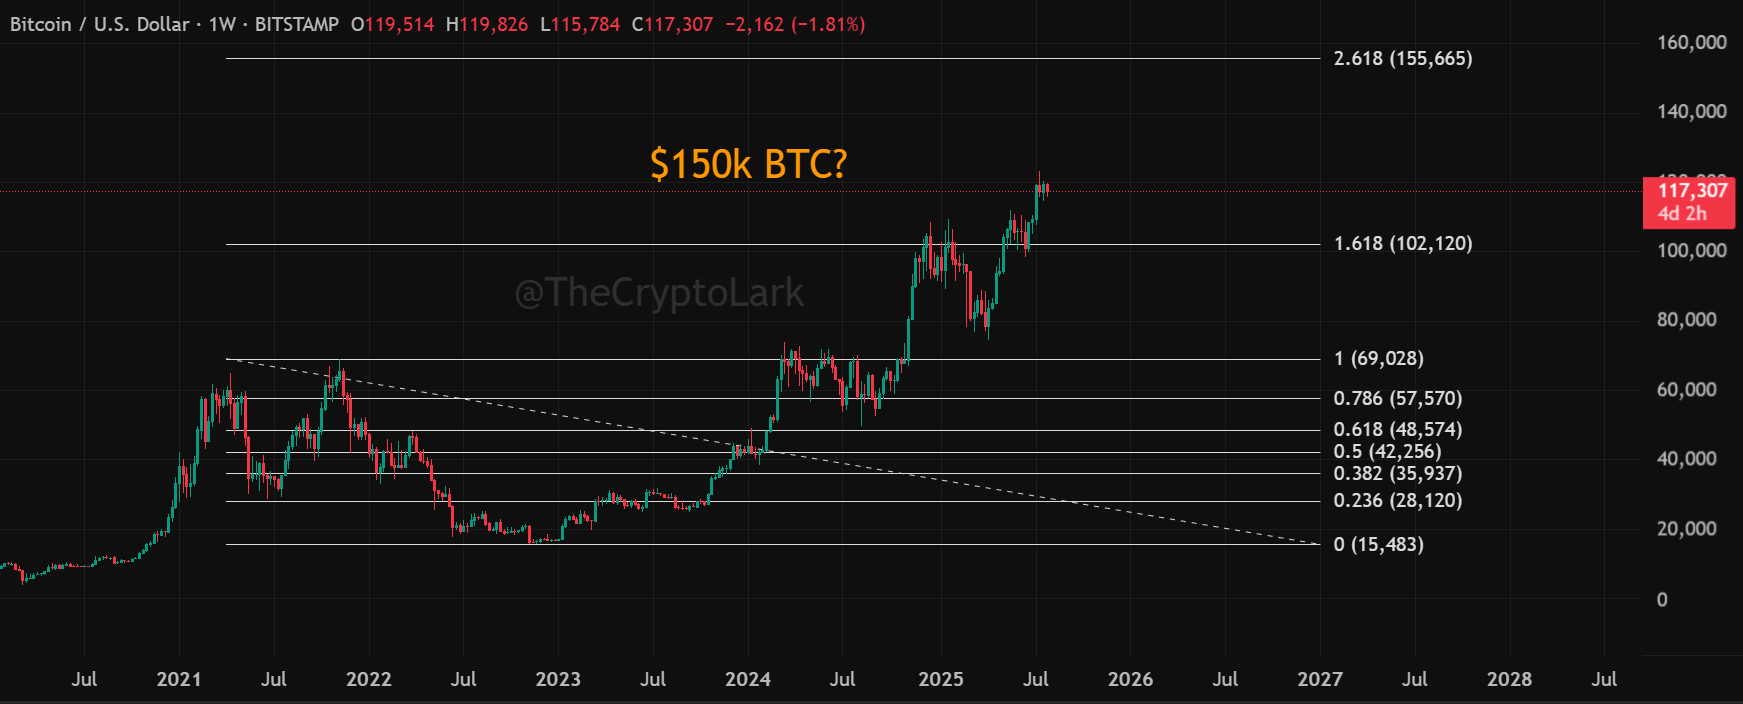
Fibonacci Levels Add Weight to the Target
The Fibonacci extension level further supports the bullish target. Davis drew the extension from Bitcoin’s all-time high of $69,028 in November 2021 to its bear market bottom at $15,483. The resulting 2.618 extension level is $155,665, which nearly matches the projected breakout target from the pattern.
Bitcoin Inverse head and ShouldersBitcoin Inverse Head and Shoulders
Bitcoin's current price is $118,024, a 0.4% rise in the past day, increasing its monthly gain to 10% amidst recent volatility. bitcoin reached a weekly high of $119,826 on July 27 after retracing from the all-time high above $123,000 recorded on July 14.
Notably, the current pattern suggests a measured move upward that supports a long-term price objective of over $150,000, assuming momentum continues, and price holds above the neckline.
Fibonacci Levels Add Weight to the Target
The Fibonacci extension level further supports the bullish target. Davis drew the extension from Bitcoin’s all-time high of $69,028 in November 2021 to its bear market bottom at $15,483. The resulting 2.618 extension level is $155,665, which nearly matches the projected breakout target from the pattern.
By:
Previous
Fold and Blackhawk Team Up to Bring Bitcoin Gift Cards to Top US Digital Retailers
Next
Corporate Giants Dump $47B Into Bitcoin in 2025—Leaving ETFs in the Dust
