Peter Brandt’s Bitcoin ’Banana Chart’ Nearing Split – Brace for Impact

Veteran trader Peter Brandt just dropped a bombshell—Bitcoin's parabolic 'banana chart' is teetering on the edge of a major split. Here's what it means for your portfolio.
When Brandt speaks, markets listen. The legendary analyst—who called Bitcoin's 2018 bottom—now spots a fractal pattern that historically precedes violent price pivots. No vague TA jargon here: this is the chart that made his career.
Banana splits aren't just for dessert menus anymore. Brandt's model suggests Bitcoin's current trajectory mirrors past parabolic advances that ended in 40%+ corrections. But there's a twist—this time, institutional inflows could rewrite the script.
Meanwhile, Wall Street's crypto tourists keep buying the dip like it's a blue-chip stock (spoiler: it's not). Whether this ends in a market-shattering breakdown or yet another 'buy the rumor' rally, one thing's certain—volatility is back on the menu.
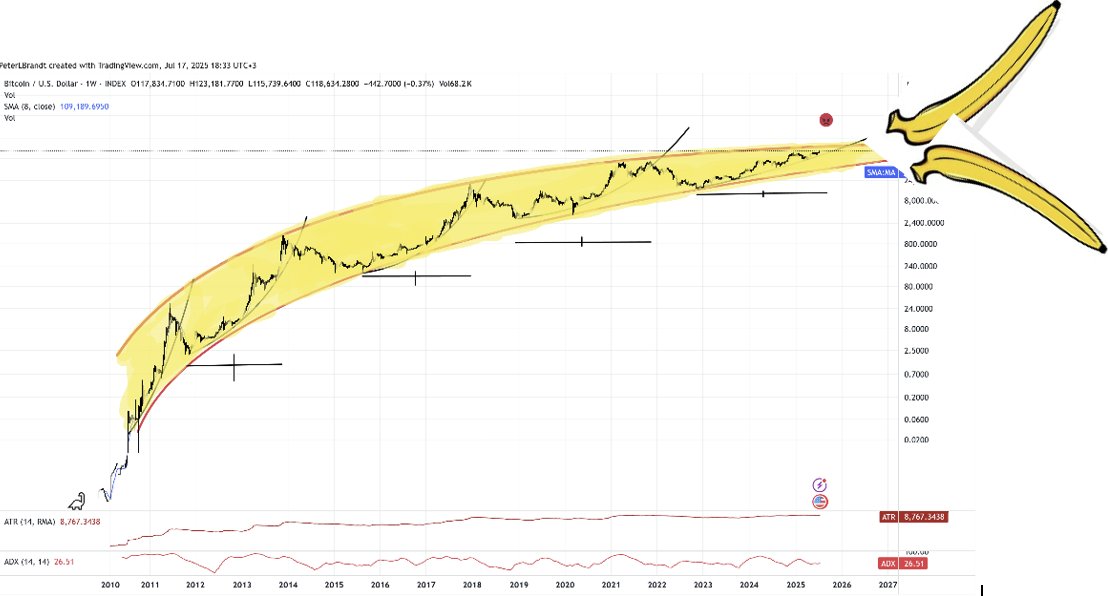 Bitcoin Banana Split | Peter Brandt
At this stage, the price of bitcoin is at a crucial resistance level, aligning with the top of the Banana chart, and Brandt is wary of its next move. The veteran analyst suggested that Bitcoin could split in two directions, either upwards to new price discoveries or downwards to retest previous prices.
Meanwhile, as a typical Banana chart and with Bitcoin’s previous reaction to the top of the pattern in previous cycles, prices could go sideways from here. Nonetheless, this remains uncertain, as many suggest that this cycle is different from previous ones due to institutional influx and an imminent supply shock.
Recall that Brandt earlier noted the possibility of a crash to $27,000, citing a recurring price action from the 2021 cycle. However, he flipped bullish a few weeks later, predicting that BTC could reach $150,000 in August.
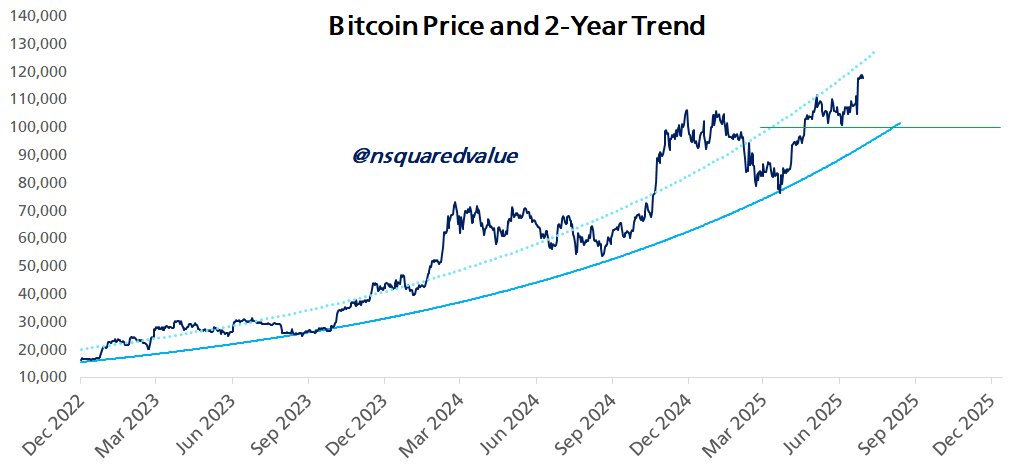
Difficult for Bitcoin to Fall Below $100,000
Meanwhile, if things go sideways for Bitcoin, it would be difficult to fall below the six-figure price mark, according to analyst Timothy Peterson. He shared this analysis in a July 17 post, drawing context from the 2-year price trend.
An accompanying chart shows Bitcoin’s price trend along with the super 2-year trend support. Bitcoin has previously held its own at each visit to the trendline, as seen during the lows of $25,000 between August and September 2023, and the sharp correction in April, which brought the price down to $74,000.
Bitcoin Banana Split | Peter Brandt
At this stage, the price of bitcoin is at a crucial resistance level, aligning with the top of the Banana chart, and Brandt is wary of its next move. The veteran analyst suggested that Bitcoin could split in two directions, either upwards to new price discoveries or downwards to retest previous prices.
Meanwhile, as a typical Banana chart and with Bitcoin’s previous reaction to the top of the pattern in previous cycles, prices could go sideways from here. Nonetheless, this remains uncertain, as many suggest that this cycle is different from previous ones due to institutional influx and an imminent supply shock.
Recall that Brandt earlier noted the possibility of a crash to $27,000, citing a recurring price action from the 2021 cycle. However, he flipped bullish a few weeks later, predicting that BTC could reach $150,000 in August.
Difficult for Bitcoin to Fall Below $100,000
Meanwhile, if things go sideways for Bitcoin, it would be difficult to fall below the six-figure price mark, according to analyst Timothy Peterson. He shared this analysis in a July 17 post, drawing context from the 2-year price trend.
An accompanying chart shows Bitcoin’s price trend along with the super 2-year trend support. Bitcoin has previously held its own at each visit to the trendline, as seen during the lows of $25,000 between August and September 2023, and the sharp correction in April, which brought the price down to $74,000.