Solana (SOL) Crashes Through Key Support—Is This the Start of a Bearish Freefall?

Solana's SOL just sliced through critical support like a hot knife through butter. Traders are now asking: Is this the beginning of a deeper correction—or just another shakeout before the next leg up?
Technical breakdown or buying opportunity?
The charts don't lie: SOL's price action turned ugly fast. With the support level now in the rearview, the question isn't whether bears are in control—it's how long they'll stay in the driver's seat. Meanwhile, 'HODL' memes are flooding crypto Twitter faster than you can say 'buy the dip.'
Remember: In crypto, 50% drops are just 'Tuesday.' But for Solana bulls banking on that fabled 'Ethereum killer' narrative, this might feel more like a Friday the 13th horror show. Just don't tell the VC bagholders.
Solana Price Dips Again
Solana price failed to clear the $210 zone and started a fresh decline, like Bitcoin and Ethereum. SOL traded below the $200 and $188 support levels to enter a short-term bearish zone.
The bears were able to push the price below the 50% Fib retracement level of the upward MOVE from the $173 swing low to the $209 high. There is also a connecting bearish trend line forming with resistance at $188 on the hourly chart of the SOL/USD pair.
Solana is now trading below $185 and the 100-hourly simple moving average. It is also below the 76.4% Fib retracement level of the upward move from the $173 swing low to the $209 high.
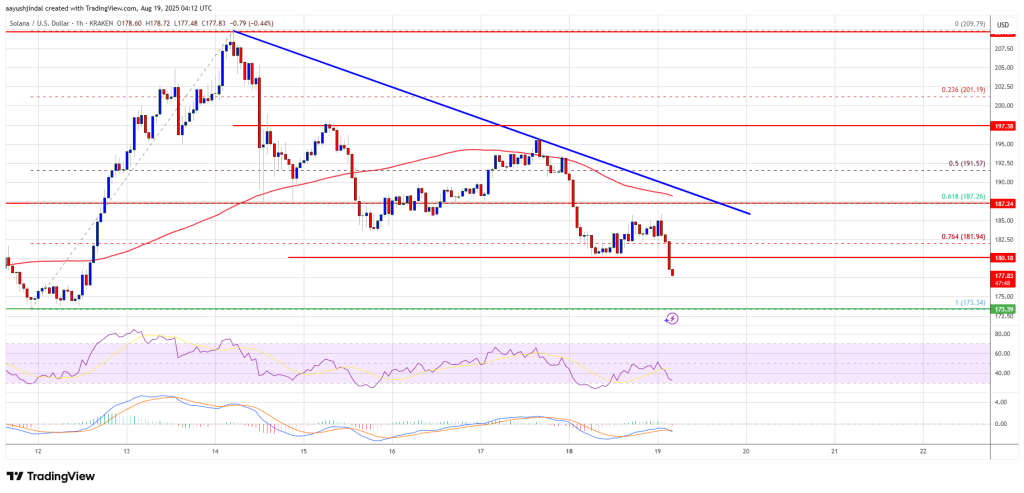
On the upside, the price is facing resistance NEAR the $182 level. The next major resistance is near the $184 level. The main resistance could be $188. A successful close above the $188 resistance zone could set the pace for another steady increase. The next key resistance is $192. Any more gains might send the price toward the $200 level.
More Losses In SOL?
If SOL fails to rise above the $182 resistance, it could continue to move down. Initial support on the downside is near the $175 zone. The first major support is near the $172 level.
A break below the $172 level might send the price toward the $162 support zone. If there is a close below the $162 support, the price could decline toward the $150 support in the near term.
Technical Indicators
Hourly MACD – The MACD for SOL/USD is gaining pace in the bearish zone.
Hourly Hours RSI (Relative Strength Index) – The RSI for SOL/USD is below the 50 level.
Major Support Levels – $172 and $162.
Major Resistance Levels – $182 and $188.
