Bitcoin Defies Gravity at Critical Support – Is the Next Rally Loading?

Bitcoin clings to its make-or-break zone as traders brace for volatility.
The Bull Case:
If support holds, BTC could mirror its historic 2024 rebound—where it ripped 300% off cycle lows. Market makers are quietly accumulating at these levels, and funding rates just flipped neutral after weeks of bearish pressure.
The Bear Trap:
Short interest on derivatives exchanges hit a 3-month high this week. A squeeze could ignite the kind of violent upside that leaves overleveraged skeptics bankrupt (again).
The Bottom Line:
This is crypto—where 'technical analysis' means guessing which whale will manipulate the chart next. But with spot ETF inflows ticking up and miners hodling like it’s 2020, the path of least resistance looks…up.
Bitcoin Price Eyes Upside Break
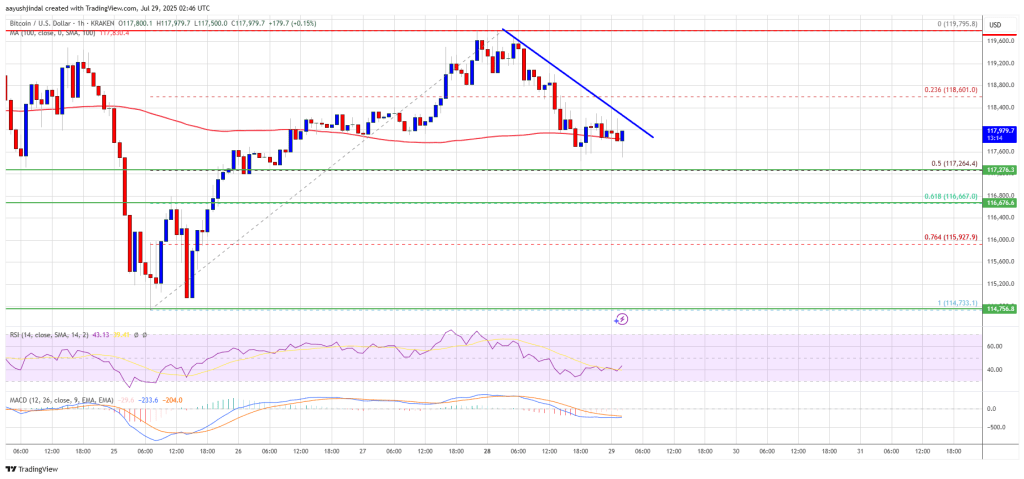
Bitcoin price started a fresh increase above the $117,000 zone. BTC climbed above the $117,500 and $118,800 resistance levels to MOVE into a positive zone.
The bulls were able to push the price above the $119,250 resistance. A high was formed at $119,795 and the pair is now correcting gains. There was a move below the 23.6% Fib retracement level of the upward move from the $114,733 swing low to the $119,795 high.
Bitcoin is now trading near $118,000 and the 100 hourly Simple moving average. Immediate resistance on the upside is near the $118,200 level. There is also a bearish trend line forming with resistance at $118,200 on the hourly chart of the BTC/USD pair.
The first key resistance is near the $119,200 level. The next resistance could be $120,500. A close above the $120,500 resistance might send the price further higher. In the stated case, the price could rise and test the $122,500 resistance level. Any more gains might send the price toward the $122,500 level. The main target could be $123,200.
More Losses In BTC?
If Bitcoin fails to rise above the $118,500 resistance zone, it could start another decline. Immediate support is near the $117,250 level or the 50% Fib retracement level of the upward move from the $114,733 swing low to the $119,795 high. The first major support is near the $116,600 level.
The next support is now near the $115,550 zone. Any more losses might send the price toward the $114,600 support in the near term. The main support sits at $113,500, below which BTC might continue to move down.
Technical indicators:
Hourly MACD – The MACD is now losing pace in the bullish zone.
Hourly RSI (Relative Strength Index) – The RSI for BTC/USD is now below the 50 level.
Major Support Levels – $117,250, followed by $116,600.
Major Resistance Levels – $118,500 and $120,500.

Log in to Reply
Log in to comment your thoughtsComments
Related Articles
|Square
Get the BTCC app to start your crypto journey
Get started today Scan to join our 100M+ users