Cronos (CRO) Primed for Breakout: Bulls Charge Toward Next Price Surge

Crypto's sleeping giant stirs—Cronos (CRO) flashes bullish signals as traders pile in for the next leg up. Forget 'slow and steady'—this altcoin's momentum is building like a DeFi yield farm in bull mode.
Technical indicators scream green, but will Wall Street's crypto tourists finally notice? (Spoiler: They’ll FOMO in after the 100% pump.)
Here’s why CRO could be the dark horse of Q3—and why your portfolio might regret ignoring it.
Why is Cronos rallying?
Cronos price is trading 6% higher during the Asian trading session on Wednesday. This rally follows an announcement on Monday by Crypto.com of a strategic partnership with THETA Network, integrating its institutional-grade custody solution to manage THETA tokens.
This partnership manages 15 million THETA tokens that have been re-staked in an Enterprise Validator Node, which suggests growing institutional trust in decentralized platforms and gaining legitimacy through a regulated US custodian.

Apart from these recent developments, Futures’ OI in CRO at exchanges rose from $29.49 million on July 8 to $49.32 million on Monday, a new all-time high, according to data from CoinGlass. Rising OI represents new or additional money entering the market and new buying, which could fuel the current CRO price rally.
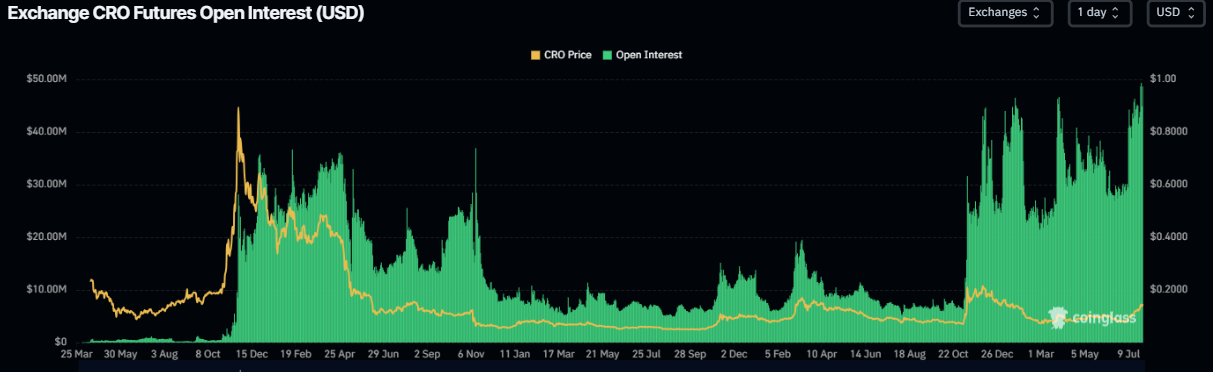
CRO open interest chart. Source: Coinglass
According to Coinglass’s data, the long-to-short ratio of Cronos reads 1.02 on Tuesday. This ratio, above one, reflects bullish sentiment in the markets, as more traders are betting on the asset price to rally.
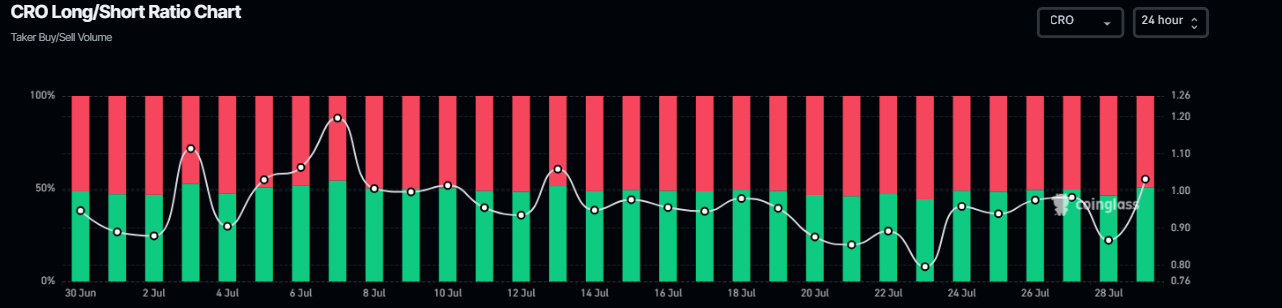
CRO long-to-short ratio chart. Source: Coinglass
Cronos Price Forecast: CRO finds support around a key level
Cronos price rallied more than 22% after breaking above the weekly resistance of $0.108 since July 17, and closed above the daily level of $0.136 on Saturday. CRO declined slightly at the start of this week on Monday and retested this daily level of $0.136. At the time of writing on Tuesday, it trades higher by nearly 7% trading above $0.145.
If the daily level at $0.136 continues to hold as support, it could extend the rally toward its 61.8% Fibonacci retracement at $0.171.
The Relative Strength Index (RSI) reads 77, pointing upward above its overbought level of 70, indicating strong bullish momentum. The Moving Average Convergence Divergence (MACD) indicator on the daily chart showed a bullish crossover in early July, and it still holds. The rising green histogram bars above its neutral value indicate increasing bullish momentum and an upward trend ahead.
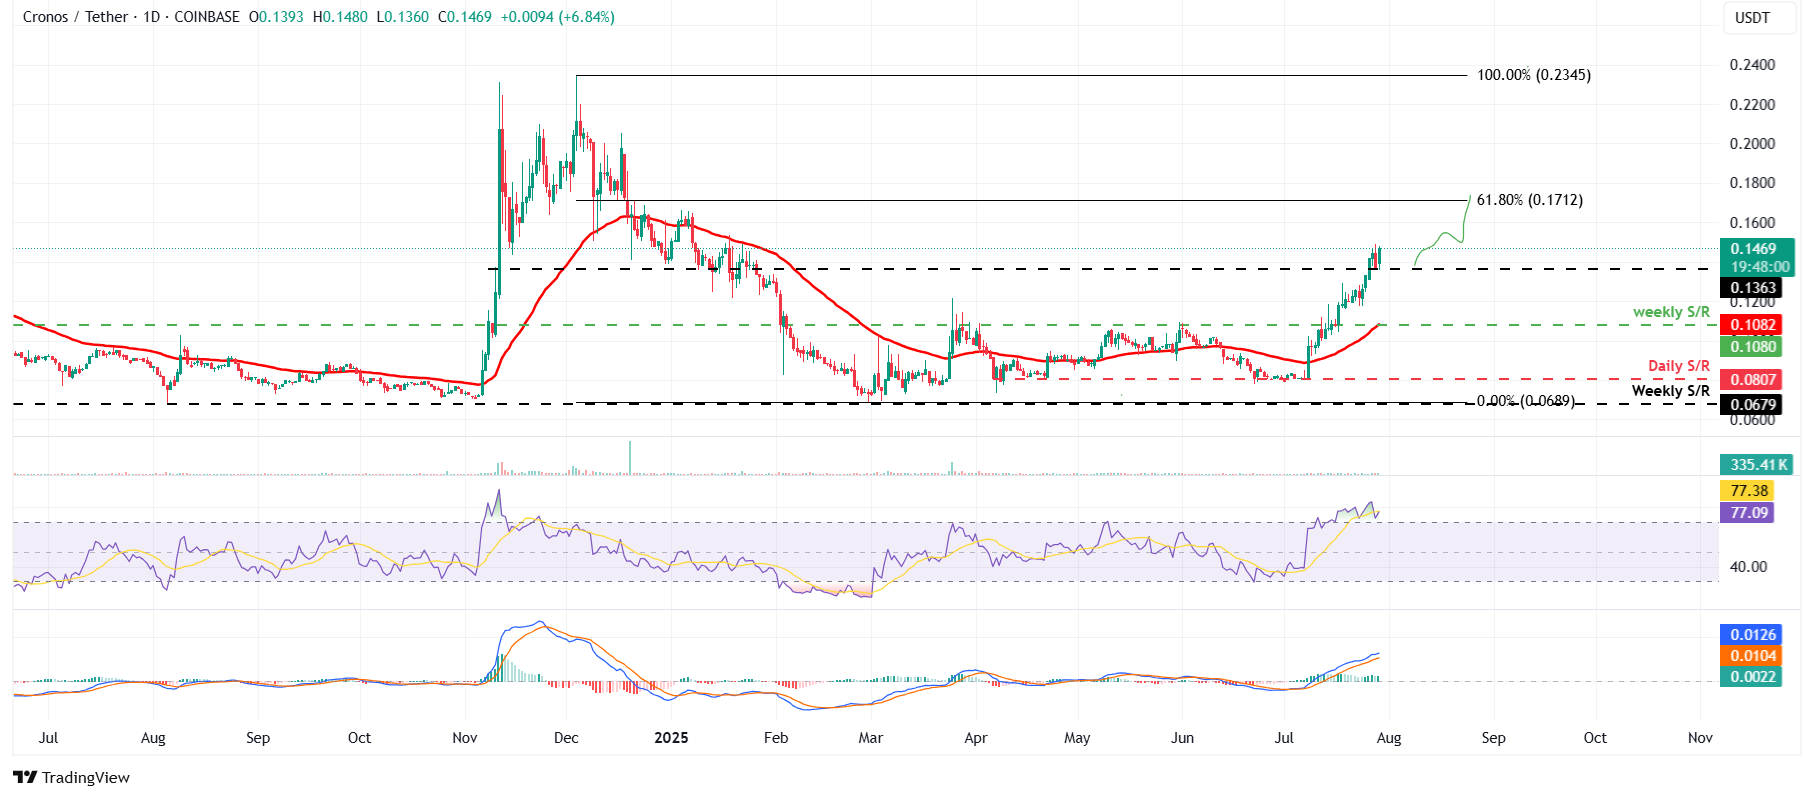
CRO/USDT daily chart
However, if CRO closes below the daily support at $0.136, it could extend the decline toward its psychological support at $0.120.
