Bitcoin’s Latest Dip? Just Another Day in Crypto—Drawdown Data Reveals No Market Panic

Bitcoin's price swings are giving traders déjà vu—yet another 'crash' that barely registers as a blip on crypto's volatility radar.
The numbers don't lie
Current drawdown analysis shows BTC's pullback fits snugly within historical norms. No mass sell-offs, no cascade liquidations—just the market breathing between rallies.
Wall Street's watching (and sweating)
While traditional investors hyperventilate over 5% dips, crypto natives yawn. The asset class that routinely shrugs off 30% corrections isn't about to panic over single-digit percentage moves—no matter how loudly CNBC anchors scream.
Funny how the 'risky' asset keeps behaving exactly as predicted while 'stable' markets get bailed out every other Thursday.
Bitcoin Volatility Remains Within Norms As Market Enters Critical Phase
According to top analyst Axel Adler, Bitcoin’s recent price action may appear sharp at first glance, but deeper analysis shows that current volatility remains well within normal historical ranges. Over the past quarter, Bitcoin’s most notable intraday drops on the 5-minute timeframe reached -10% in early June and -12% in mid-June. Meanwhile, the average weekly drawdown, represented by the green line on Adler’s chart, remains stable at 3.8%.
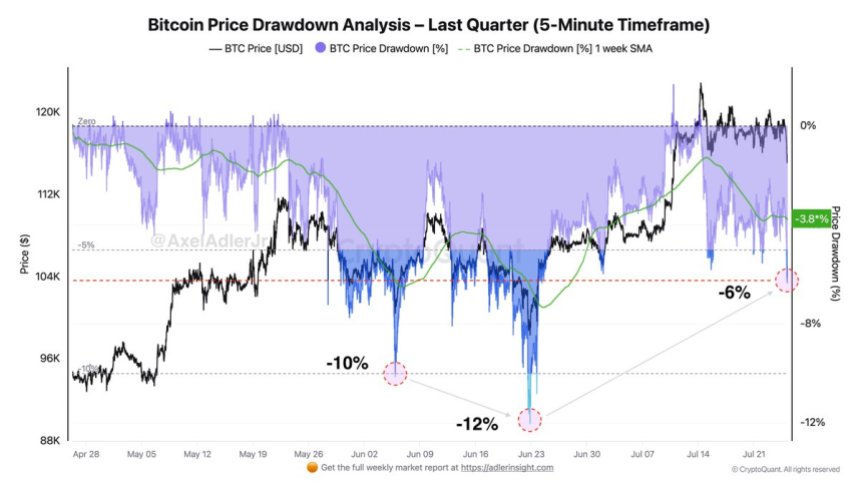
The current -6% pullback—following Bitcoin’s recent breakout to $123K and its retrace toward $115K—sits only 2.2% deeper than this weekly average and is still far from the panic-triggering extremes seen in previous months. Despite the dramatic visual appearance, Adler emphasizes that the current correction aligns with a standard consolidation cycle often seen during bull markets.
What makes this moment especially relevant is how other parts of the crypto market are behaving. While altcoins retraced heavily yesterday, today they are holding above key support levels, signaling potential strength and a possible shift in market dynamics. This resilience across major altcoins could mark a rotation of capital within the market, rather than an exit.
BTC Falls Below Key Support as Volume Spikes
Bitcoin has broken below the tight consolidation range it maintained for over two weeks, with price dropping sharply to a local low of $115,009 before slightly recovering to $115,759. This marks a clear technical breakdown of the horizontal channel between $115,724 and $122,077, as shown in the 4-hour chart. The breach below the lower bound coincided with a spike in volume, signaling decisive selling pressure from market participants.

The drop pushed BTC below the 50-day (blue) and 100-day (green) simple moving averages (SMAs), both of which previously acted as dynamic support. The price is now hovering just above the $115,724 horizontal support zone, which is now being retested. A failure to hold this level could open the door to deeper retracements toward the 200-day SMA NEAR $112,104, which could act as the next major support level.
Technically, a bearish structure is developing in the short term, especially after the breakdown from the triangle-like compression (marked in blue). However, the elevated volume accompanying the move may also suggest capitulation from weak hands, which can precede a reversal. In the coming sessions, Bitcoin’s ability to reclaim the $118K level will determine whether bulls can regain control.
Featured image from Dall-E, chart from TradingView

Log in to Reply
Log in to comment your thoughtsComments
Related Articles
|Square
Get the BTCC app to start your crypto journey
Get started today Scan to join our 100M+ users