Litecoin Defies Market Chaos: 5-Year Bullish Trendline Holds Strong Since 2020

Litecoin's structural integrity remains unshaken—while traditional markets flip-flop on Fed whispers, the 'digital silver' keeps etching higher lows like a metronome.
The Unbreakable Chart
No flashy narratives, no VC hype trains. Just a clean, ascending trendline that's weathered every crypto winter since 2020. While altcoins crumble under regulatory scrutiny, LTC's price action keeps tracing that same stubborn diagonal.
Market Physics at Work
Five years of persistent accumulation show in the charts. Retail traders chasing quick pumps might overlook it, but that steady support line tells the real story—whales are stacking, not flipping.
Funny how the 'boring' coins outlast the vaporware ICOs that promised to revolutionize everything (except delivering returns). Maybe slow and steady does win the race—or at least survives the SEC's paperwork avalanche.
Positive Technical Indicators
In his analysis, The Boss stated that Litecoin’s momentum is strengthening, as reflected by the RSI (Relative Strength Index), which is currently around 64. This level also indicates growing buying strength in the market, suggesting that bulls are gradually gaining control and pushing prices higher without yet hitting overbought conditions.
Moving on to momentum indicators, the Boss explained that the MACD is trading in positive territory and has experienced a recent bullish crossover. This signal reinforces the rising momentum seen in Litecoin’s price action and the potential continuation of the existing trend if buyers maintain pressure.
Additionally, Moving Averages (MA) are working in Litecoin’s favor. The Boss explained that $LTC is trading above both short- and long-term moving averages, particularly holding above the 50-day and 200-day MAs, which further supports the bullish outlook. These moving averages are critical support levels, and staying above them often attracts more bullish interest.
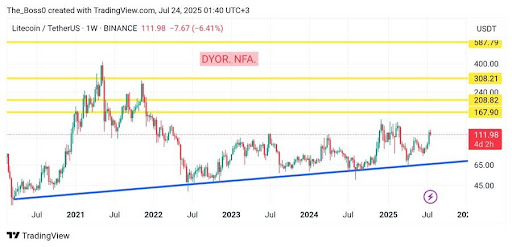
Looking ahead, Fibonacci Zones provide key technical targets. The analyst emphasized that the $100 – $112 range remains a key technical resistance zone. A breakout above this level could open the path toward higher yellow-line targets, which are the next logical price areas to watch if momentum continues.
Channeling Strength: LTC Holds Its Bullish Structure
The Boss, in his structural analysis of Litecoin, noted that the price of LTC has remained within a well-defined ascending channel that has been in place since 2020. This long-term trendline has repeatedly acted as a strong support level, providing a foundation for upward moves.
As long as LTC stays above this trendline, The Boss maintains a bullish mid-to-long-term outlook. This suggests that the overall trend remains intact, with potential for further gains if the price continues to respect this channel.
In summary, The Boss maintains a bullish stance, underpinned by a combination of positive RSI and MACD signals, strong support from major moving averages, and clear resistance zones. He suggests that a push through the $100 – $112 range could trigger a larger upward MOVE for Litecoin, taking aim at those higher yellow-line targets on the chart.
