Ethereum’s Descending Broadening Wedge Mirrors 2019-2020 Setup – History Might Repeat (Here’s How)

Ethereum's chart is flashing a familiar pattern—one that last appeared before its 2020 bull run. The descending broadening wedge, a technical formation notorious for trapping bears, has emerged again. And if history rhymes? Buckle up.
Why This Pattern Matters
Widening price swings with lower highs and lower lows often signal exhaustion in a downtrend. When ETH carved this shape in late 2019, it preceded a 1,500% rally. Traders are now eyeing the same setup—though Wall Street analysts will likely dismiss it as 'voodoo' until their Bloomberg terminals confirm the breakout.
Key Levels to Watch
The wedge's upper trendline currently acts as resistance, while the lower boundary offers potential accumulation zones. A decisive close above resistance could trigger algorithmic buying en masse—just like last time. Meanwhile, crypto OGs are stacking ETH and laughing at traditional finance's 'wait-and-see' approach.
Remember: Technical analysis is just educated gambling. But when the charts align with network fundamentals (hello, Ethereum's burn mechanism), even skeptics pay attention. The wedge tightens—will ETH cut through or collapse? Either way, it'll be entertaining.
Ethereum Shows Descending Broadening Pattern
In an X post, Crypto Bullet stated that ethereum has shown an impressive recovery and is now starting to resemble a Descending Broadening Wedge pattern. He further noted that this pattern is almost identical to the one which ETH had between 2019 and 2020. The analyst added that the picture looks very bullish right now. Between 2019 and 2020, when this pattern emerged, the altcoin rallied from around $180 to $700 in just six months.
Further commenting on the current ethereum price action, Crypto Bullet revealed that the altcoin is testing the resistance at around $3,700 for the third time. He believes that ETH will eventually break out from this range. However, the analyst warned that there may be a 10 to 15% pullback around that area before that.
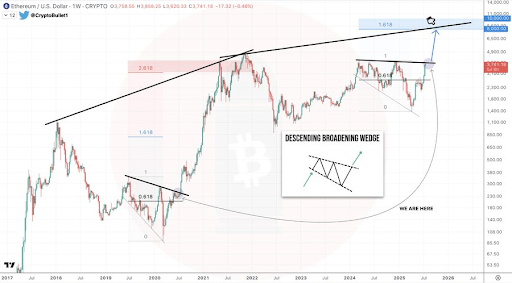
Meanwhile, Crypto Bullet assured that Ethereum will rally hard once it breaks out from this formidable resistance. He predicts that this breakout will lead to a new all-time high (ATH) for ETH, meaning the altcoin is likely to reach $4,900 on the next uptrend. The analyst also stated that the cycle top target for ETH is between $8,000 and $10,000.
Crypto analyst Mikybull Crypto is also confident that Ethereum can reach $10,000 before this market cycle ends. In an X post, he stated that the euphoria stage will start when ETH breaks a new all-time high (ATH). He indicated that the break above ATH will spark a rally to between $7,000 and $10,000. Once that happens, the analyst believes that a massive bear market will ensue.
ETH Is Yet To Enter The Banana Zone
In an X post, crypto analyst Ted stated that Ethereum is yet to enter the banana zone. He noted that right now, the altcoin is going through a correction after pulling a 70% rally from its April 2025 lows. The analyst further opined that there will be some sideways accumulation before ETH breaks above $4,100.
However, once that happens, he predicts that Ethereum will record the “most violent rally.” His accompanying chart showed that ETH could rally to a new ATH of around $7,000 on the first leg up. Based on the chart, Ted also believes that the altcoin could reach $14,000, $41,000, and $92,000 at some point.
At the time of writing, the Ethereum price is trading at around $3,563, down over 4% in the last 24 hours, according to data from CoinMarketCap.
