Ethereum’s 2025 Surge Mirrors 2017’s 5,000% Explosion—Here’s Why History Could Repeat

Ethereum’s price action is flashing eerie similarities to its legendary 2017 bull run—the one that minted crypto millionaires overnight. Traders are buzzing as ETH charts paint a familiar pattern: the same coiled-spring consolidation that preceded last cycle’s meteoric rise.
The Setup: Deja Vu in Decentraland
Like a blockchain-powered Groundhog Day, Ethereum’s current trajectory mirrors the slow grind before its historic breakout. Back then, skeptics called it a fluke. Now? Institutional money’s elbowing in like Wall Street at a free-bar crypto conference.
The Catalyst: More Than Just Hype
This isn’t 2017’s wild west. Ethereum’s ecosystem has actual legs now—DeFi protocols handling billions, NFTs that aren’t just JPEGs, and an upgrade cycle that (finally) makes gas fees less highway robbery. The network’s grown up… mostly.
The Punchline: Banks Hate This One Trick
While traditional finance tries to NFT-ify mortgage bonds, Ethereum’s quietly rebuilding the financial stack. Will it repeat 2017’s 5,000% moonshot? Maybe not exactly. But with staking yields beating savings accounts and developers fleeing centralized chains, the smart money’s betting on another explosive chapter.
Remember: past performance guarantees nothing—except smug ‘I told you so’ tweets if this plays out.
Ethereum Price Mirrors Bullish 2017
Back in 2017, before the bull market, the Ethereum price had struggled to stay on track with the Bitcoin price. This resulted in a lag as the price kept taking a beating with each uptrend. In the end, the Ethereum price ended up ranging for a while, with two fakeouts before the price was able to eventually breakout.
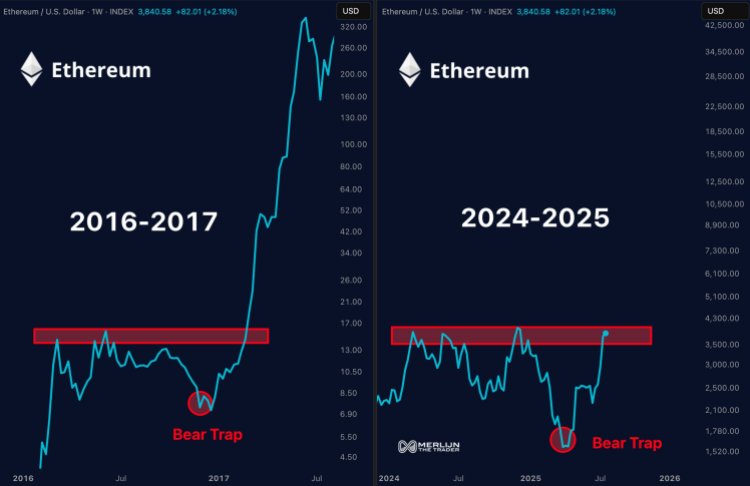
Similarly, the ethereum price has ranged for the last year, with multiple fakeouts that have already kept the price low. Just like 2017, again, a crash sent the altcoin’s price down by almost 50% to create what seemed to be the perfect bear trap, as illustrated in this chart by crypto analyst Merlijn The Trader on X (formerly Twitter).
The analyst points out these similarities in the Ethereum chart, showing that the same range, fakeout, and breakout have now played out for the cryptocurrency just like they did in 2016-2017. Given this, it is likely that the next phase in the trend will also follow the 2017 playbook.
After the bear trap and eventual breakout in 2017, the Ethereum price had rallied by 5,000%, going from under $8 to over $250 in less than one year. Applying a similar breakout structure to Ethereum in 2025 would mean rising as high as $40,000.
However, adjusting for how high the market cap currently is, a conservative target WOULD mean that the Ethereum price is at least able to cross the $10,000 level, which would be only a 200% increase from its current level. Applying the same timeframe as in 2017 would mean that it could play out in the next six months.
Additionally, Ethereum now has something that it didn’t have back in 2017, and that is institutional backing. Presently, Ethereum is quickly becoming a favorite among institutional investors as ETH treasury companies have poured over $7 billion into the altcoin, according to data from The Block. In July 2025 alone, over $2 billion has flowed into Spot Ethereum ETFs, showing a ramp-up in institutionalized interest.
Due to this rise in institutional investments, Merlijn The Trader has explained that institutions are now the ones behind the wheel with the same setup from 2017. This suggests higher liquidity as these major players are expected to drive and determine the ETH price this cycle.

Log in to Reply
Log in to comment your thoughtsComments
Related Articles
|Square
Get the BTCC app to start your crypto journey
Get started today Scan to join our 100M+ users