XRP Plummets 13% in 24 Hours—But These Two Signals Hint at a Bottom

XRP just got wrecked—again. The token nosedived 13% in a single day, leaving bagholders scrambling. But before you dump your stack into the abyss, two on-chain metrics suggest this freefall might finally hit a floor.
Blood in the streets? Check. Panic sells? Obviously. Yet lurking beneath the chaos, the data whispers: capitulation might be close. Of course, in crypto, 'close' could mean minutes—or another 30% drop. Thanks, 'efficient markets.'
So is it time to buy the dip? If history’s any guide (it rarely is), XRP’s oversold bounce could be violent. Or it’ll keep drilling straight to zero. Either way, grab popcorn—this is finance’s most entertaining clown show.
Derivatives Market Shows Why XRP Might Have Crashed, And The Worst May Be Over
XRP’s 13% crash might have been triggered by a wave of long liquidations. That means many traders who were betting on XRP to go up were using borrowed money. When the price started falling, their positions hit stop levels and got automatically sold by exchanges. This forced selling likely caused the sharp drop to $2.99.
: Want more token insights like this? Sign up for Editor Harsh Notariya’s Daily crypto Newsletter here.
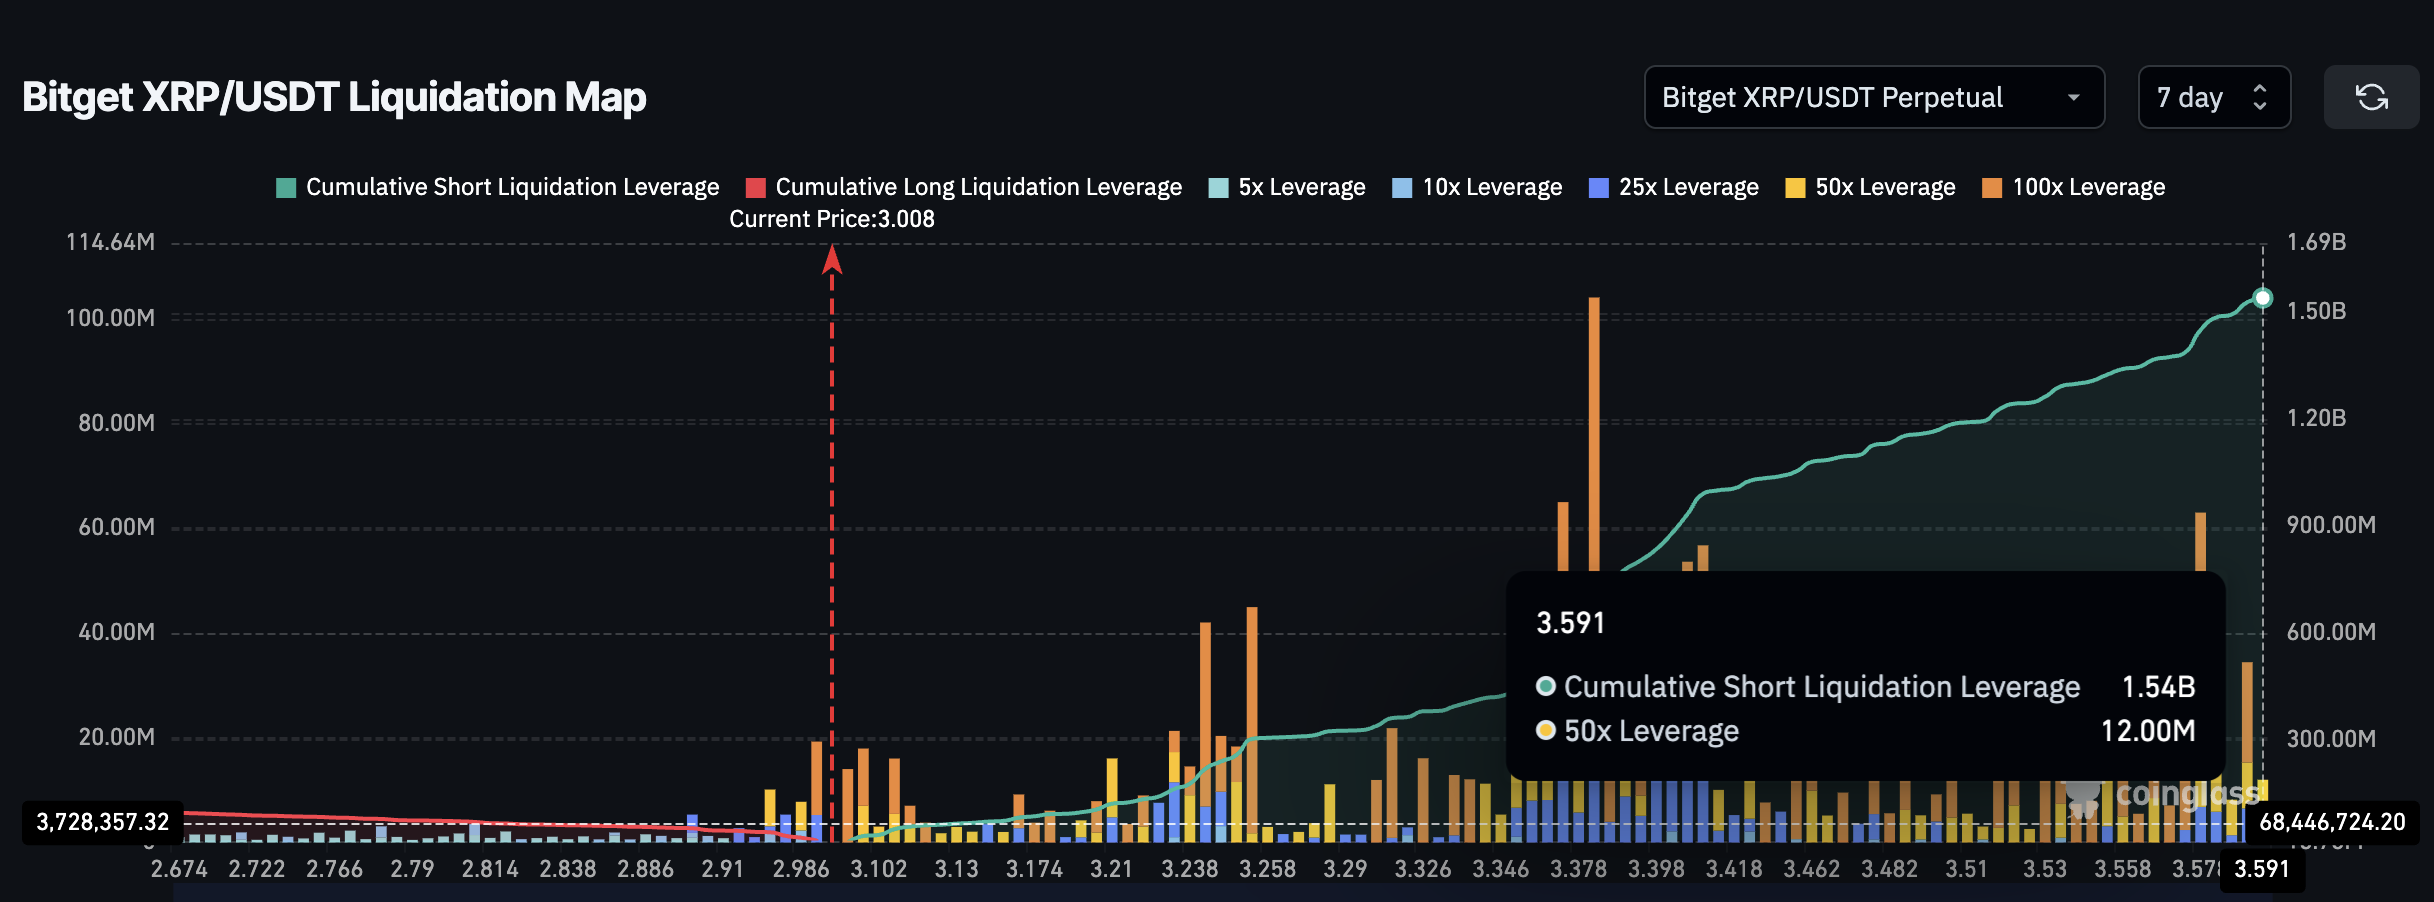
We can see this on the Bitget XRP-USDT Liquidation Map (7-day). The chart shows that most of those Leveraged long positions have already been wiped out. Right now, there’s less than $100 million worth of long liquidations left, which is tiny compared to what was there earlier. This means most of the leveraged longs are already cleared out.
With fewer long trades left to liquidate, the forced selling pressure might now be easing. In simpler terms, there’s not much more downside fuel left from this kind of panic-sell mechanic. That’s why this freefall could soon slow down.
But there’s one more thing to watch: a huge wall of short liquidation levels building above $3.59. If XRP starts bouncing and pushes higher, those short positions might get squeezed next, triggering upside moves.
The liquidation chart is from the derivatives market, and it helps explain when crashes might stop or when bounces could begin.
Spot Market Volume Hints at Buyers Stepping Back In
While the derivatives market shows that forced selling might be cooling off, the spot market is also flashing something interesting. The OBV (On-Balance Volume), a metric that tracks whether volume is flowing in or out of a coin, is actually rising, even though the xrp price has been dropping.
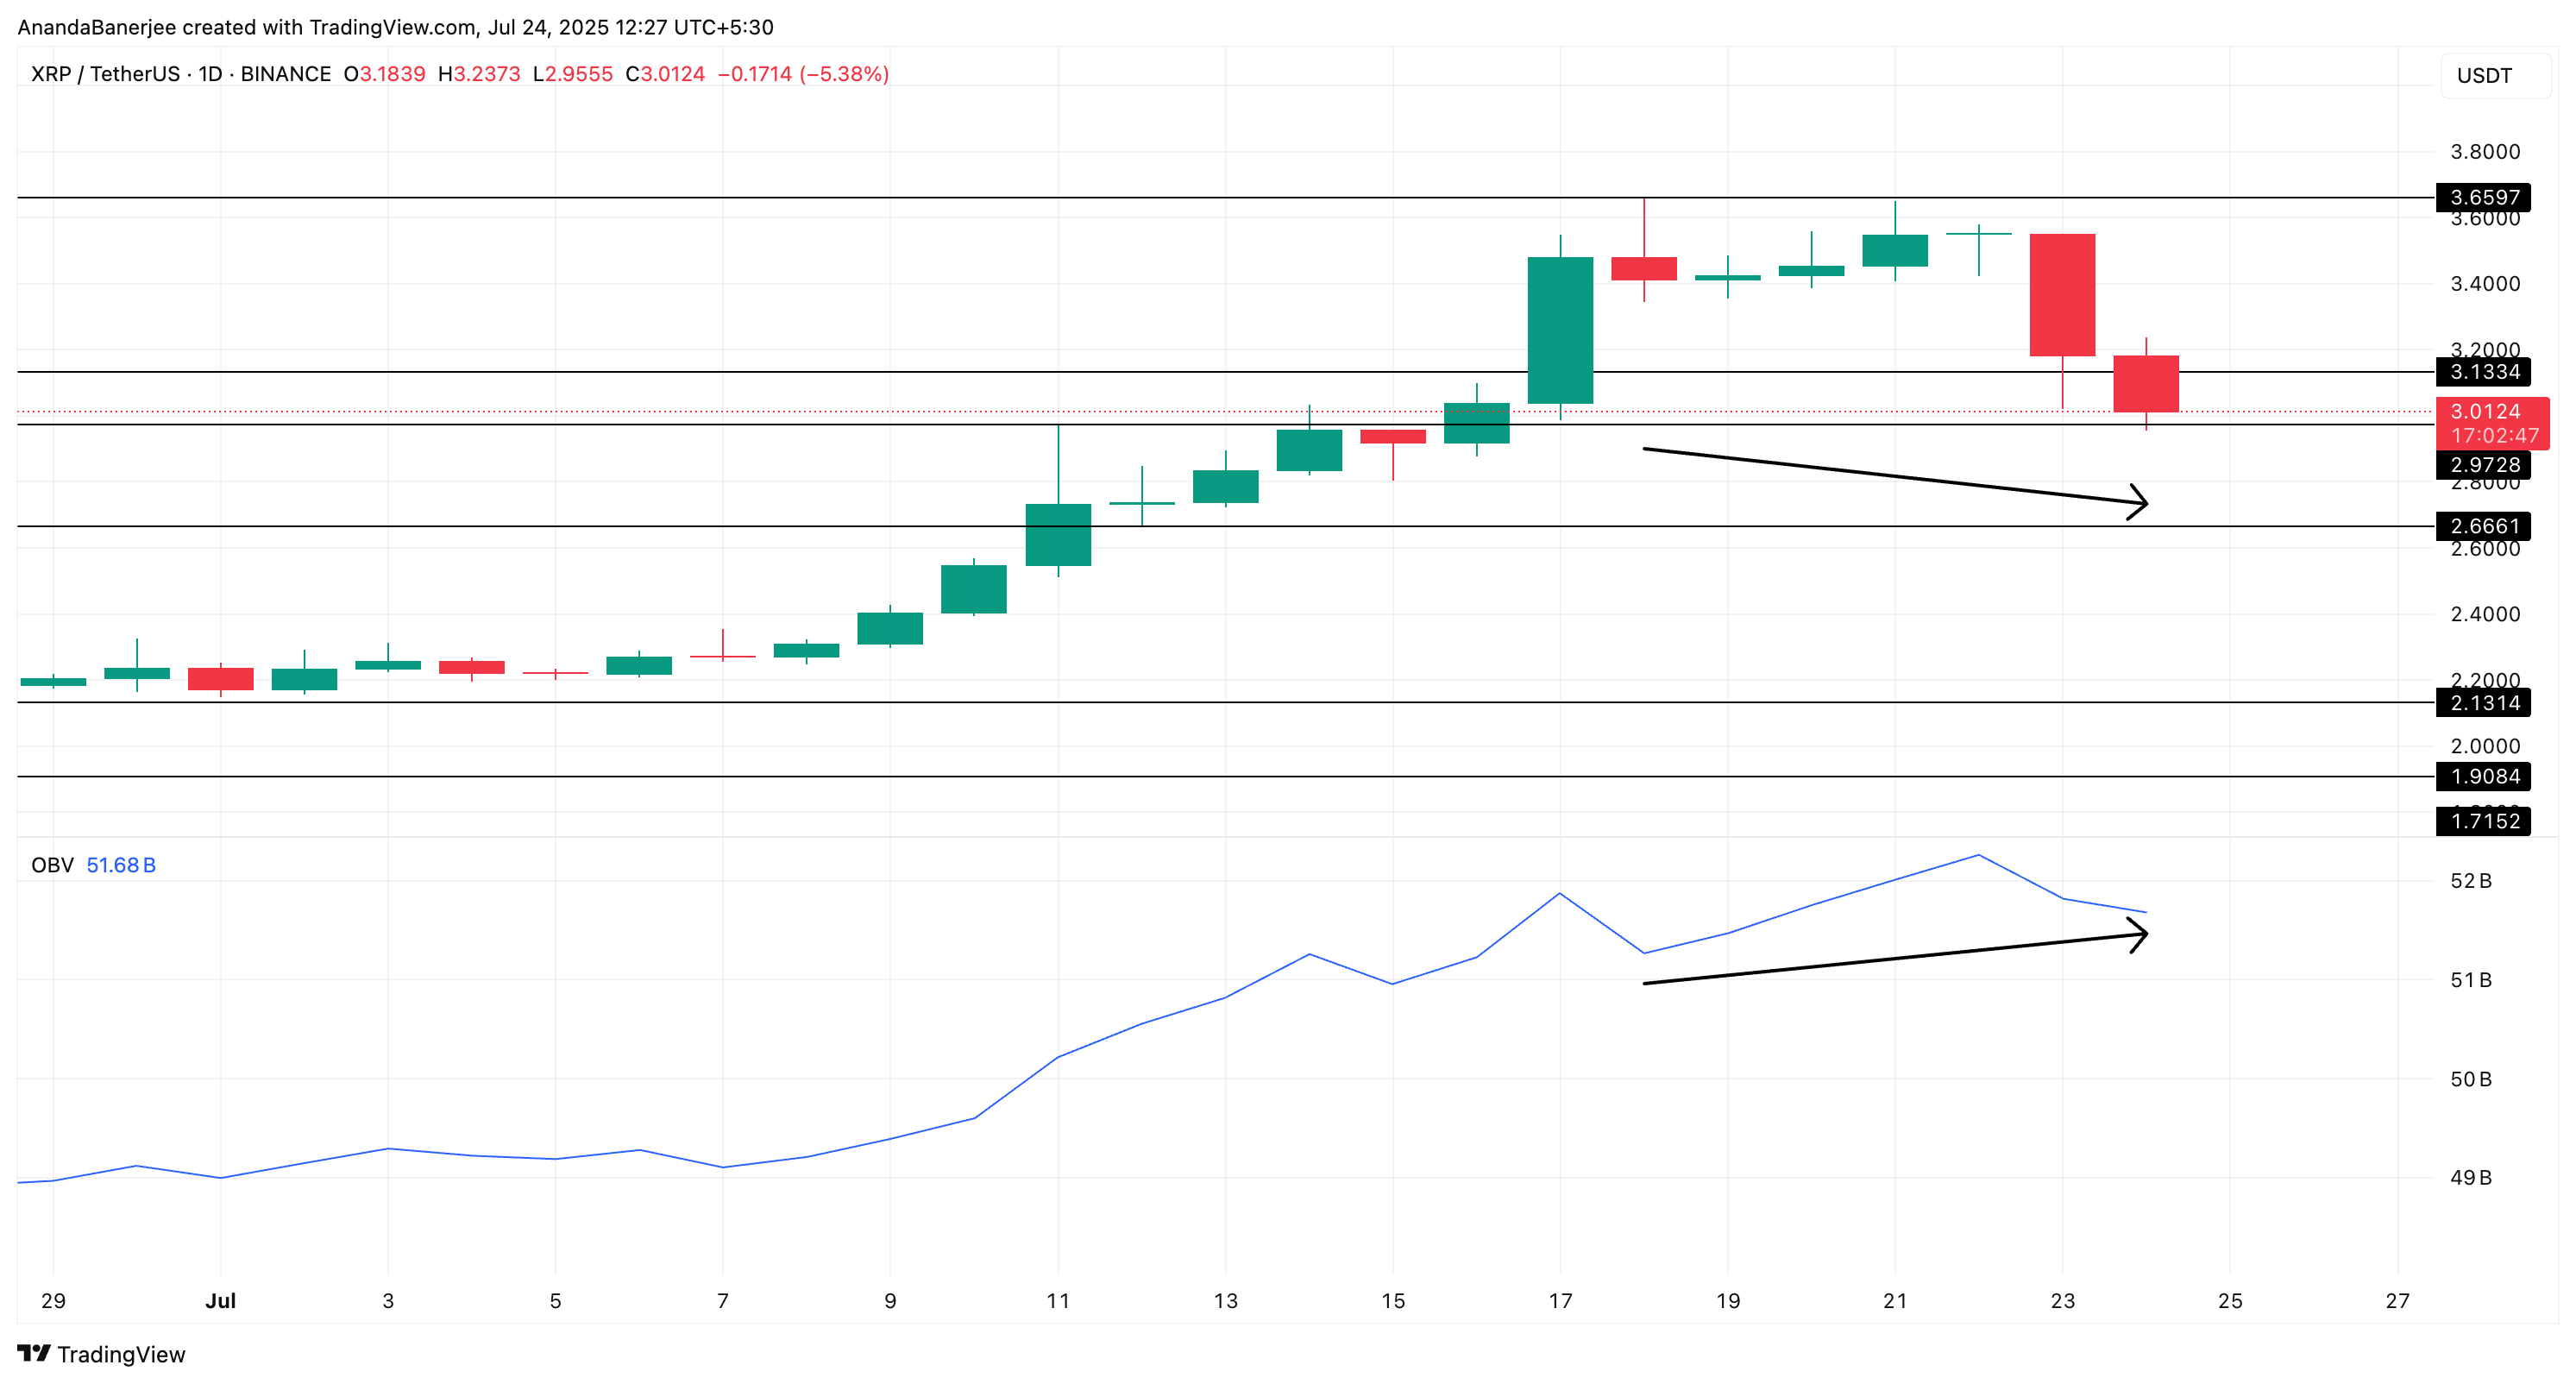
That’s a bullish divergence. It means people are still buying XRP on spot exchanges, even while the price is falling. OBV going up means more volume is happening on green candles than red ones. So even though XRP is down at $2.99, the underlying volume action is not confirming the bearish trend.
This ties well with the derivative data: the forced selling might be ending, and real buyers might be stepping in quietly. In past cases, this kind of OBV divergence often shows up just before a price reversal or at least a short-term bounce.
This makes OBV a strong spot-market signal. It doesn’t confirm a full XRP price recovery yet, but it does suggest that selling pressure is being absorbed and that the downtrend might be losing power.
XRP Price Holds Key Levels Amid Crash
XRP price is now trading just under $3.00, after falling nearly 13% in a single day. That drop sliced through the important $3.13 support, and now price is hovering around $2.99; a level that lines up with the 0.382 Fibonacci retracement.
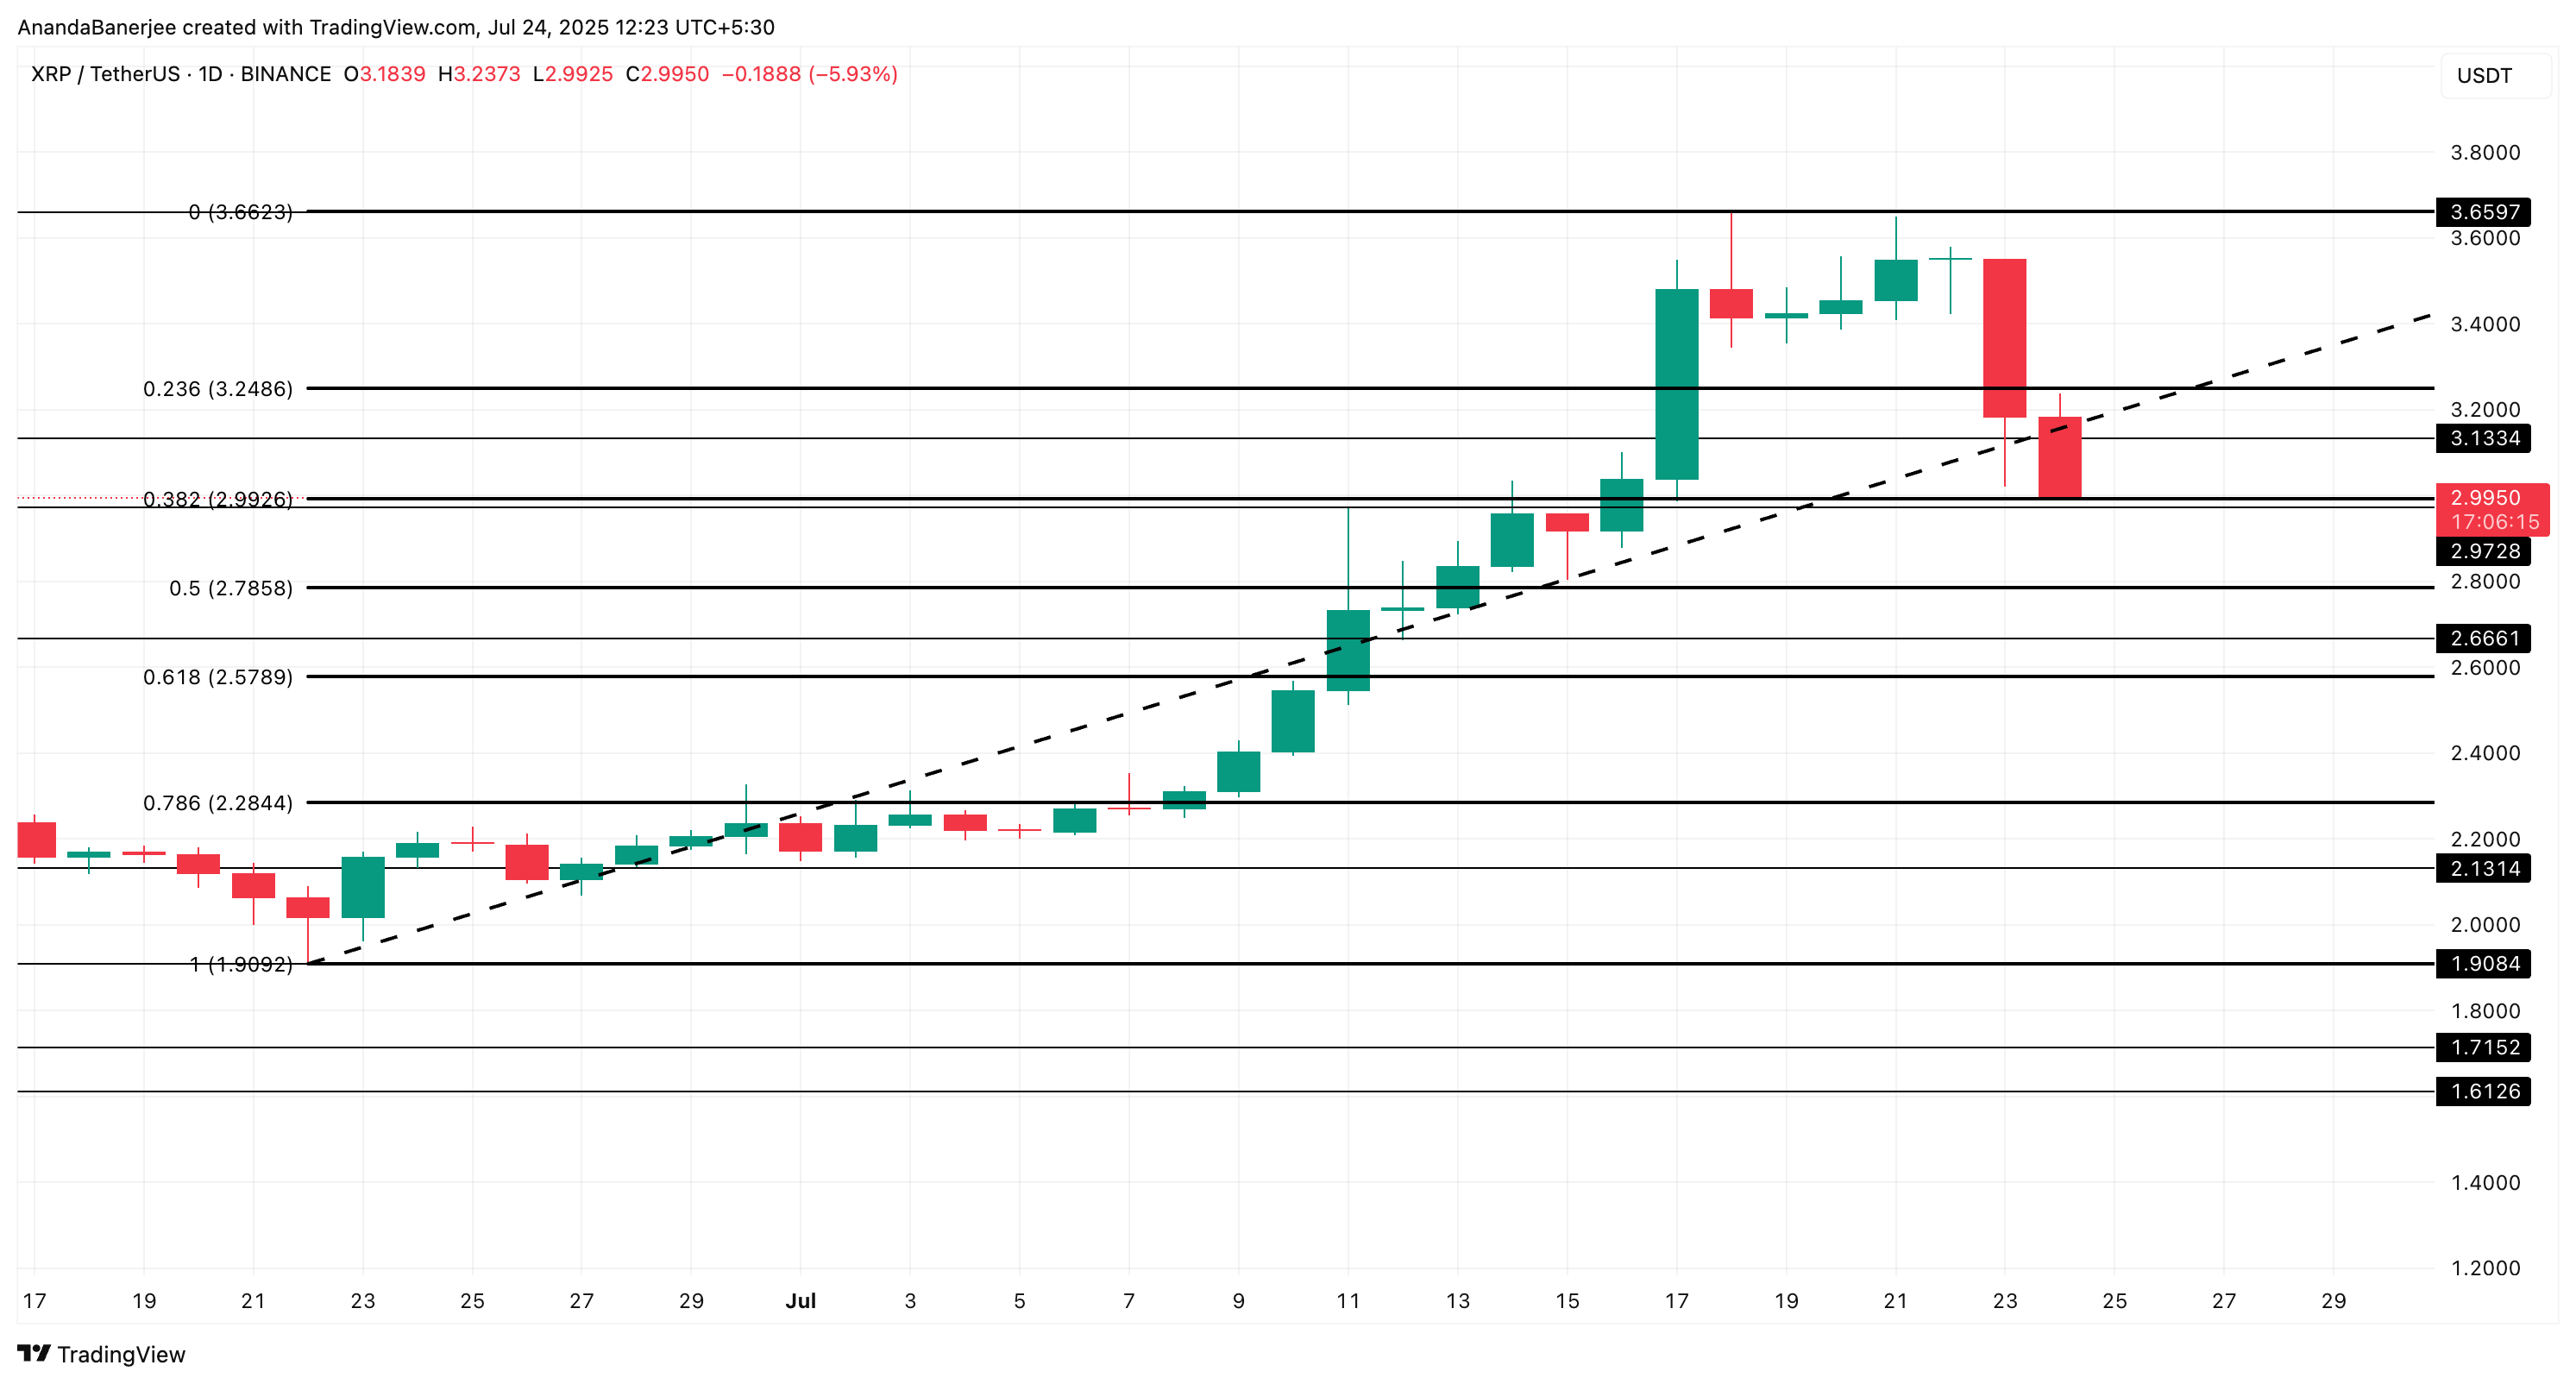
This level is key. If XRP holds above it, a short-term bounce could play out, especially with OBV showing strength and long liquidations mostly exhausted. But if $2.99 fails, the next strong level sits at $2.78: the 0.5 Fibonacci retracement. That becomes the make-or-break zone.
The Fibonacci retracement indicator was used here, connecting the last major swing low of $1.90 to the swing high or the all-time high of $3.65. This FORM of retracement charts key support levels if the asset starts dropping.
Below $2.78? Things get dicey and the bounce expecation gets thrown out of the window. A fall to $2.66 or even $2.28 could happen fast, especially if sellers regain momentum. But right now, the indicators suggest the correction may be slowing.
For any bounce to stick, XRP needs to reclaim $3.13. If it can’t, traders should watch for more downside.
