Litecoin Soars Past $110 – Is This the Start of a New Bull Run for LTC?

Litecoin just blasted past $110 in a 20% rally—now traders are scrambling to figure out where it goes next.
### The Breakout: More Than Just a Pump?
LTC’s surge isn’t happening in a vacuum. With Bitcoin grinding higher and altcoins waking up, Litecoin’s move could be part of a broader momentum shift. Or, you know, just another crypto fakeout before the usual ‘buy the rumor, sell the news’ circus.
### Key Levels to Watch
$110 was the hurdle—now it’s about holding. If Litecoin stabilizes here, the next target could be $130 (the last resistance before its 2024 highs). But if this is another ‘dead cat bounce,’ well… enjoy the ride down.
### The Big Question: Can Litecoin Stay Relevant?
Sure, it’s one of the OGs—but in a world of DeFi tokens and AI hype-coins, LTC’s ‘digital silver’ schtick feels quaint. Then again, sometimes boring works. Just ask the Wall Street suits still trading fax machines.
### Bottom Line
Litecoin’s got momentum. Whether it’s got staying power is the real bet. Place yours wisely—preferably before the hedge funds front-run this too.
Is LTC About To Witness A 900% Surge?
In a recent post on the X platform, Chartered Market Technician (CMT) Tony Severino painted an excitingly bullish picture for the Litecoin price even after its recent market exploits. According to the crypto expert, the price of LTC is on the verge of a bullish breakout that could decide its trajectory over the next few months.
This bullish projection is based on a multi-year contracting (or symmetrical) triangle pattern on the Litecoin 2-week chart. The contracting triangle is a pattern in technical price analysis marked by a falling upper boundary (connecting a series of lower highs) and a rising lower trendline (connecting a series of higher lows).
In a symmetrical triangle pattern, the asset price continuously contracts and moves toward the apex. Eventually, the price will breach the upper trendline for a breakout or breach the lower trendline for a breakdown. This chart formation could be a continuation or reversal pattern depending on the break’s direction (breakout or breakdown) and the initial trend direction.
However, symmetrical triangles are often continuation patterns, meaning the price tends to break in the initial trend direction before it fell into the triangle pattern. So, if history is anything to go by, the Litecoin price is likely to continue its upward trend after it breaks out of the current setup.
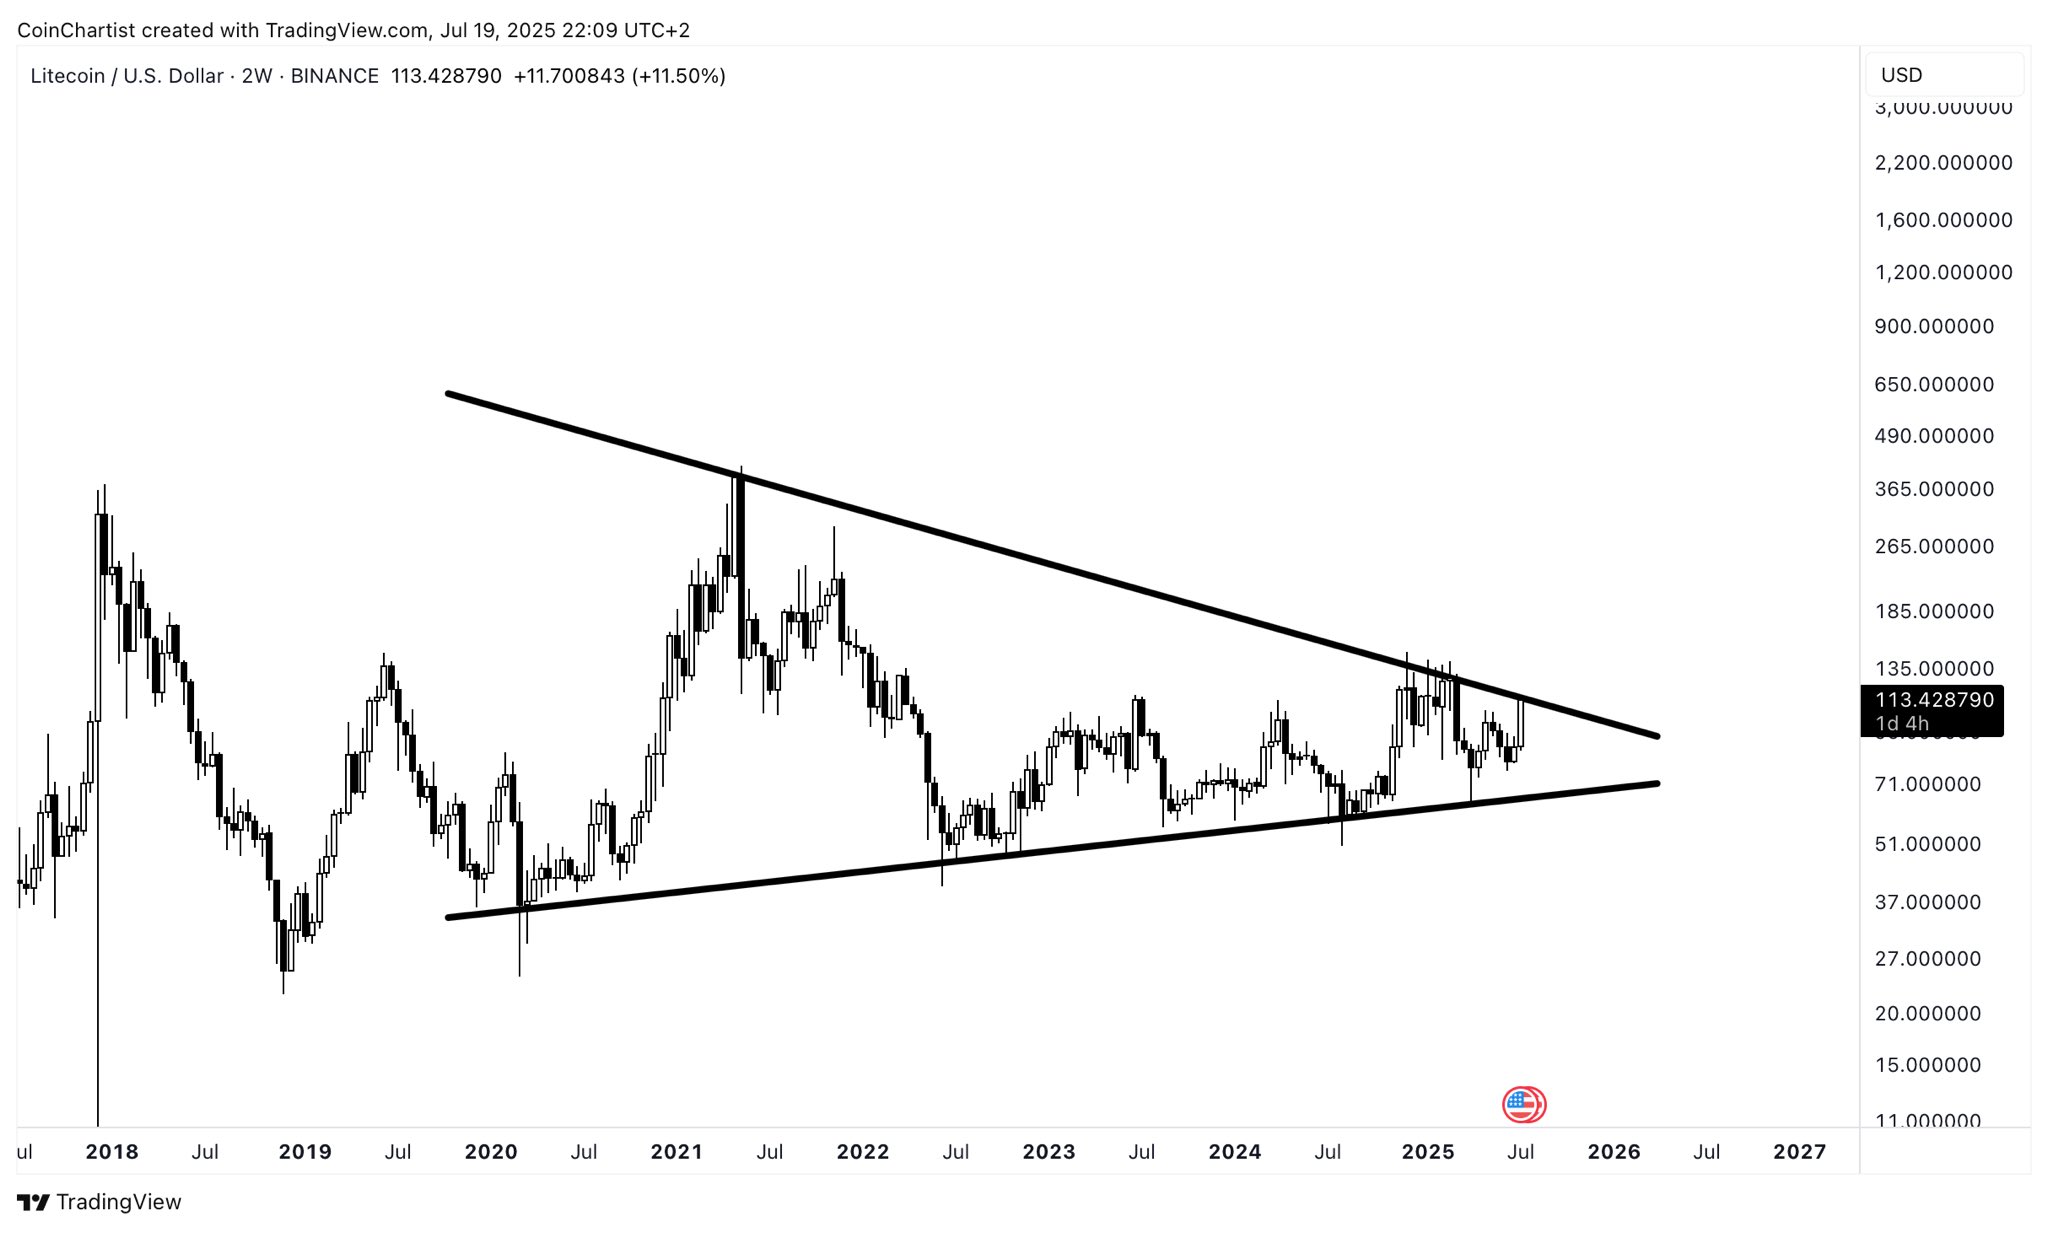
As Severino pointed out, the Litecoin price is preparing to break out of this multi-year symmetrical triangle and could be on track to break above its current all-time high of $410. In a contracting triangle formation, the price target is determined by adding the length of the widest point of the triangle (or base) to the breakout point.
Going by this logic, the price of Litecoin could be on the verge of an over 900% surge over the next few months.
Litecoin Price At A Glance
As of this writing, the price of LTC sits at around $112.5, reflecting a nearly 11% gain in the past 24 hours.
