Bitcoin Miner Sales Rocket to Highest Since April – Here’s Why It Matters

Miners are cashing out at levels not seen since spring—and the market's taking notice.
Hashrate meets hard reality: When Bitcoin miners flood exchanges with sell orders, it usually means one thing: they're scrambling for liquidity. Either to cover operational costs... or to lock in profits before the next volatility tsunami.
The April deja vu: Last time sales spiked this hard, BTC price wobbled 12% within weeks. Coincidence? Traders with PTSD from Q2 aren't waiting to find out.
Wall Street's watching: Funny how 'decentralized' crypto still dances to the tune of industrial miners' balance sheets. But hey—at least this time they're not selling to pay electricity bills... probably.
Miners Take Profits As Bitcoin Hits All-Time High
Fresh data from CryptoQuant reveals that bitcoin miners have resumed aggressive selling behavior as BTC reached a new all-time high of ~$123,000. On July 15, miner outflows spiked to 16,000 BTC — the highest single-day total since April 7. This level of activity represents what analysts at CryptoQuant describe as an “extreme outflow,” indicating that miners seized the opportunity to take profits at elevated prices.
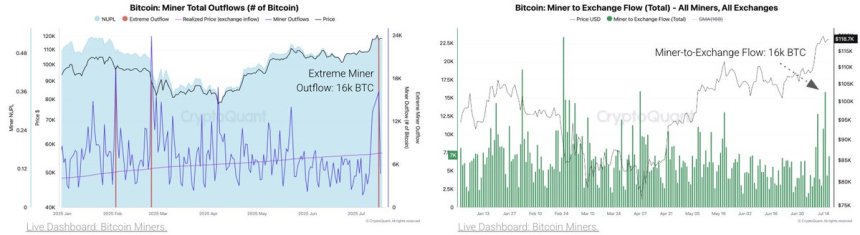
The miners sent nearly all the BTC they withdrew from their wallets directly to centralized exchanges. This reinforces the interpretation that the MOVE was not simply a strategic reallocation but an active decision to sell into market strength. Such behavior often signals growing caution among miners, who may expect either near-term price exhaustion or are simply capitalizing on favorable conditions after months of holding.
Miner behavior has long been viewed as a leading indicator of potential market shifts. When outflows rise — particularly to exchanges — it tends to precede increased volatility or temporary tops. While the broader Bitcoin trend remains bullish and investor demand stays strong, this wave of miner selling injects a dose of uncertainty.
BTC Consolidates Below ATH After Explosive Rally
The daily chart of Bitcoin (BTC/USD) shows price consolidating in a tight range between $115,730 and $123,230 after reaching a new all-time high. This zone is now acting as a short-term channel, with buyers defending the $115K area while facing resistance around $123K. The latest daily candle shows low volatility, suggesting indecision among traders as Bitcoin pauses after its recent breakout.
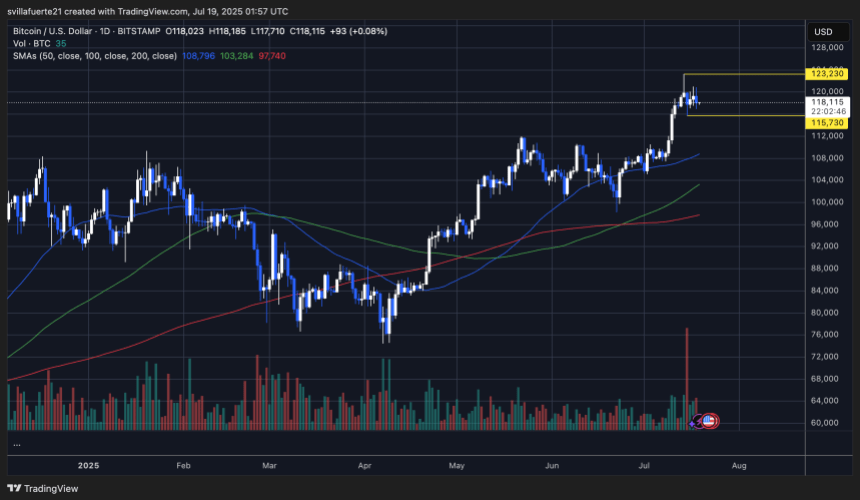
Volume has tapered off following a massive spike that coincided with the all-time high breakout, a potential signal of exhaustion or reduced participation from large buyers. The 50-day simple moving average (SMA) at $108,796 remains well below the current price, confirming the bullish momentum is still intact, but any breakdown below the $115K level could bring the 50-day SMA into focus as a potential support.
Related Reading: All 40K Remaining Bitcoin From The 80K Whale Just Moved: $4.75B In One Wallet Now
So far, the trend structure remains bullish, but with a growing number of analysts pointing to miner sales and whale activity, traders are closely monitoring price action for signs of a pullback or renewed breakout. If BTC can reclaim $123,230 with volume, the next leg up could follow. Until then, this consolidation may serve as a healthy cooldown before the next major move.
Featured image from Dall-E, chart from TradingView
