🚀 Bitcoin Primed for $123K Mega-Rally—Traders on High Alert for Historic Breakout

Bitcoin's coiled-spring price action hints at an explosive move—and institutional sharks smell blood in the water.
The $123K psychological magnet
Chart patterns echo late-2020's parabolic setup, back when Wall Street analysts scoffed until BTC shredded their price targets. This time, even gold-bugs are quietly accumulating.
Liquidity hunt underway
Order books show algos stacking bids below $100K while leveraged shorts get liquidated hourly. 'It's not FOMO driving this—it's pure reflexivity,' remarks a hedge fund quant between sips of $28 cold brew.
Warning lights flashing
Derivatives markets hit extreme greed levels last seen before March's 30% correction. Meanwhile, crypto Twitter oscillates between 'number go up' memes and existential dread about Fed meetings.
The ultimate irony? Banks that called Bitcoin worthless in 2022 now run clandestine OTC desks for their wealthiest clients—just don't expect them to put it in their quarterly reports.
Bitcoin Price Eyes Fresh Upward Move
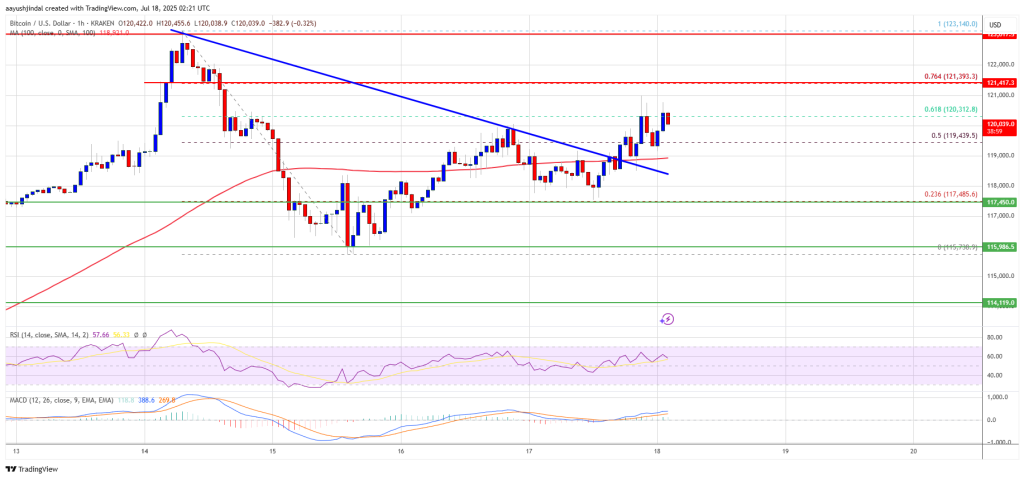
Bitcoin price started a correction from the new high at $123,200. BTC dipped below the $120,000 level and tested the $115,500 zone.
A low was formed at $115,730 and the price is now attempting a fresh increase. The bulls were above to push the price above the $118,000 and $118,500 resistance levels. There was a move above the 50% Fib retracement level of the move from the $123,140 swing high to the $115,730 low.
Besides, there was a break above a bearish trend line with resistance at $119,000 on the hourly chart of the BTC/USD pair. Bitcoin is now trading above $119,500 and the 100 hourly Simple moving average.
Immediate resistance on the upside is NEAR the $120,200 level. The first key resistance is near the $121,400 level. It is close to the 76.4% Fib retracement level of the move from the $123,140 swing high to the $115,730 low. The next resistance could be $123,150.
A close above the $123,150 resistance might send the price further higher. In the stated case, the price could rise and test the $124,200 resistance level. Any more gains might send the price toward the $125,000 level. The main target could be $126,200.
Another Decline In BTC?
If bitcoin fails to rise above the $121,400 resistance zone, it could start another decline. Immediate support is near the $119,000 level and the 100 hourly SMA. The first major support is near the $117,500 level.
The next support is now near the $115,500 zone. Any more losses might send the price toward the $113,500 support in the near term. The main support sits at $110,500, below which BTC might continue to move down.
Technical indicators:
Hourly MACD – The MACD is now losing pace in the bullish zone.
Hourly RSI (Relative Strength Index) – The RSI for BTC/USD is now above the 50 level.
Major Support Levels – $117,500, followed by $115,500.
Major Resistance Levels – $121,400 and $123,150.
