Bitcoin’s Hourly Close Hints at Imminent Breakout – Here’s Why Traders Are Buzzing

Bitcoin's hourly chart just flashed its most bullish signal since the last halving—and institutional traders are scrambling to reposition.
The telltale squeeze: Bollinger Bands on the 60-minute chart have tightened to levels not seen since January's 30% rally. Meanwhile, perpetual funding rates remain neutral—no overheated leverage here.
Make-or-break moment: A decisive close above $67,200 (last week's liquidation cluster) could trigger algorithmic buying at scale. But as always with crypto, watch for the classic 'fakeout before breakout' gambit favored by market makers.
Wall Street's open secret: Three US spot ETF issuers quietly increased their BTC custody balances by 12% this week. Because nothing says 'hedge against inflation' like front-running your own clients' orders.
Whether this is the real deal or another headfake, one truth remains: Bitcoin moves fastest when liquidity is thinnest. Buckle up.
BTC’s Momentum Builds With Healthy Technical Backing
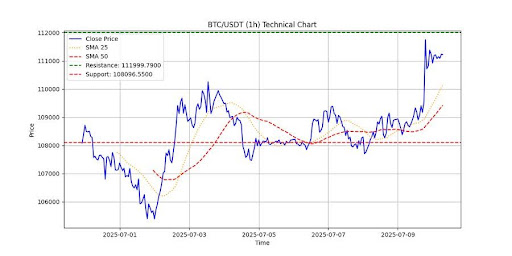
In his latest 1-hour market update, Shaco AI noted that Bitcoin continues to humor the bulls, printing a strong close at $111,225.5. The price action has maintained a clear bullish bias, staying well above both the 25-hour simple moving average (SMA) at $110,147 and the 50-hour SMA at $109,420. This positioning suggests that BTC is building a solid base for continuation, with short-term trend followers likely remaining confident in the move.
Furthermore, the MACD has widened impressively, with a gain of $589.72, reflecting persistent buying pressure and bullish sentiment. As the MACD histogram expands and signal lines diverge, it reinforces the idea that the bulls may be far from done, and dips could be viewed as buying opportunities.
Shaco AI also pointed to the Relative Strength Index (RSI), which now sits at 63.73. This level shows that the market is in a healthy bullish zone, strong enough to maintain upward momentum, but not yet in overbought territory that typically invites profit-taking or cooling off.
Adding confidence to the trend, the Average Directional Index (ADX) has hit 38.93, which Shaco AI emphasized as a key confirmation that the current trend has strength and durability. With all key indicators pointing to continued bullish structure, supported by rising momentum, trend alignment, and strong directional force, Bitcoin’s short-term technical picture remains decisively positive. The bulls are in control, and the chart suggests they may not be done pushing just yet.
Breakout Or Breakdown? Bitcoin Poised At A Technical Crossroads
Shaco AI, in his final remarks, highlighted that bitcoin is approaching critical territory, marking resistance at $111,999.79 and support at $108,096.55 as the key zones to watch. He urged traders to “watch these like a hawk!” as price action around these levels could be decisive in determining BTC’s next major move.
He also pointed out that trading volume has been unusually quiet, joking that it “seems to have missed some coffee breaks,” with just 395 units recorded compared to the average of 869. This lighter volume signals reduced conviction, which could lead to sudden volatility or fakeouts NEAR those key zones. “Keep those eyes peeled for potential breakouts or retracements as BTC flirts with key levels, but do remember there’s caution in the air with this lighter trading volume,” the expert added.
