Solana (SOL) Hits Resistance Wall — Can the Rally Regain Momentum?

Solana's comeback hits a snag as key resistance holds firm. The 'Ethereum killer' isn't dead—but it's not exactly slaying either.
Price action stalls at critical level
SOL bulls face their first real test after a sharp recovery. The token's 30-day surge met stiff selling pressure—classic crypto whiplash in action.
Technical hurdles ahead
Chartists eye the $150 zone as make-or-break territory. Break through? New highs beckon. Fail? Prepare for another round of 'max pain' memes.
Meanwhile, Bitcoin maximalists smugly adjust their laser eyes—because nothing says 'sound money' like gloating over altcoin struggles.
Solana Price Trims Gains
Solana price started a decent increase after it cleared the $150 resistance, like Bitcoin and Ethereum. SOL climbed above the $152 level to enter a short-term positive zone. There was a move above the 50% Fib retracement level of the downward move from the $160 swing high to the $144 low.
However, the bears were active NEAR the $156 resistance. They protected a move above the 76.4% Fib retracement level of the downward move from the $160 swing high to the $144 low.
The price is now moving lower and trading below the $154 level. solana is now trading near $152 and the 100-hourly simple moving average. There is also a key bullish trend line forming with support at $151 on the hourly chart of the SOL/USD pair.
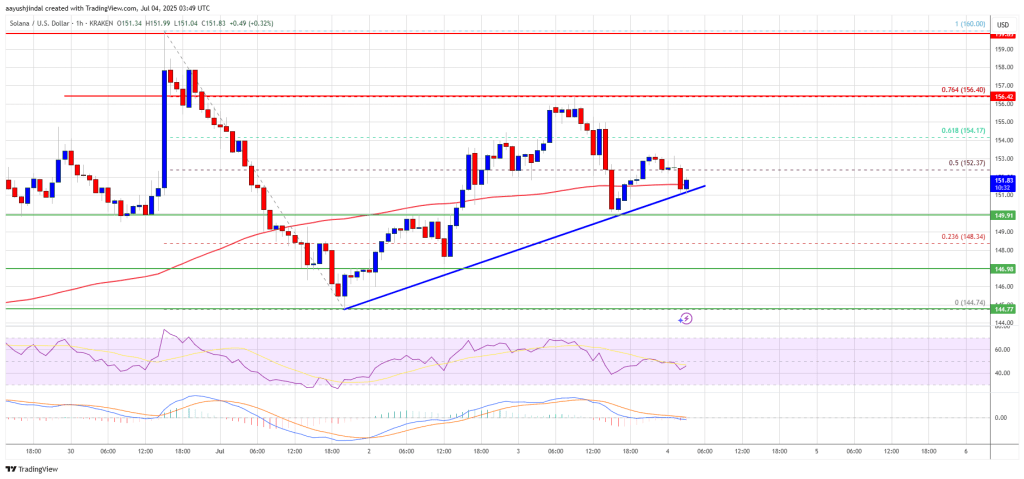
On the upside, the price is facing resistance near the $155 level. The next major resistance is near the $156 level. The main resistance could be $160. A successful close above the $160 resistance zone could set the pace for another steady increase. The next key resistance is $162. Any more gains might send the price toward the $165 level.
Another Decline in SOL?
If SOL fails to rise above the $155 resistance, it could start another decline. Initial support on the downside is near the $150 zone. The first major support is near the $146 level.
A break below the $146 level might send the price toward the $142 zone. If there is a close below the $142 support, the price could decline toward the $136 support in the near term.
Technical Indicators
Hourly MACD – The MACD for SOL/USD is losing pace in the bullish zone.
Hourly Hours RSI (Relative Strength Index) – The RSI for SOL/USD is below the 50 level.
Major Support Levels – $150 and $146.
Major Resistance Levels – $155 and $160.
