Bitcoin Primed for $130K Surge? Wave Count Hints at Explosive Rally Ahead

Forget sideways action—Bitcoin's chart is flashing a big, bullish signal. Wave analysis suggests the king crypto could be gearing up for a moonshot to $130,000. Here's why traders are watching the count like hawks.
The Elliott Wave Whisperers
Technical analysts live for these moments. The current wave pattern—if it holds—mirrors previous pre-pump structures. When BTC gets this rhythmic, it typically doesn't end with a whimper.
Institutional FOMO Fuel
BlackRock's ETF approval last year opened the floodgates. Now every hedge fund manager who mocked crypto owns some 'just in case.' Nothing like career risk to make converts out of skeptics.
The Cynic's Corner
Let's be real—Wall Street only loves volatility when they can front-run retail. But this time, the little guys might actually catch the wave first. For once.
One thing's certain: if Bitcoin punches through six figures again, the suits won't be far behind. The question isn't if, but when—and how violently.
Bitcoin’s Wave 2 Correction Might Be Complete
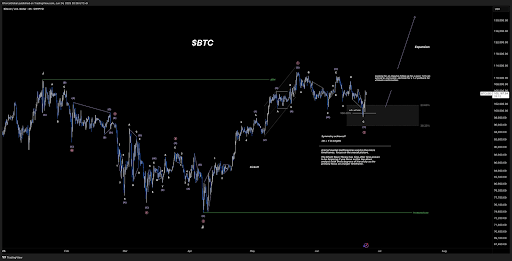
According to XForceGlobal, a crypto analyst who posted a detailed Elliott Wave chart on the social platform X, Bitcoin’s recent correction fits neatly within a completed WXY pattern. The second wave, which started following the all-time high of $111,814 on May 22 and formed the corrective structure, has now retraced into the expected Fibonacci range between the 23.6% and 38.2% levels. Notably, the ideal minimum target for this correction move was in the $90,000 region, and bitcoin fulfilled that condition with the pullback to just under $98,200 over the weekend.
The most important thing was in preserving the macro wave structure. Instead of drawing out a deeper pullback into the 0.618 to 0.886 Fibonacci levels, which is often characteristic of bear market retracements, the analysis maintains the idea that this was a wave 2 correction within a larger bullish impulse.
This distinction is important. If the WXY correction is indeed complete and wave 2 has concluded, the next logical MOVE in the Elliott Wave sequence is a third wave advance. According to Elliott Wave analysis, the third wave is often the most explosive in terms of price expansion. Its outcome could therefore push the price of Bitcoin to new heights that are significantly higher than its most recent all-time high.
Why $130,000 Is A Realistic Target For Bitcoin
The analyst’s technical projection on Bitcoin’s 4-hour candlestick timeframe chart shows an expected wave 3 trajectory extending beyond $111,800, with an expansion arrow reaching up above $130,000. This is the expansion move and is based on a similar projection of Wave 1.
In the accompanying chart, the analyst marks the key pivot zone between $98,000 and $102,000 as the Wave C termination area. If this zone indeed marks the completion of the second wave, the next movement WOULD require validation through the formation of a clear 1-2 structure within Wave 3.
This means that confirmation of the bullish count also depends on the price making a new local high above the current range and then pulling back without breaching the recent lows. If that structure plays out, then the market would likely be in the early stages of a powerful third wave.
Bitcoin has already made an 8% price gain after it dropped to a low of $98,200 following U.S. airstrikes on Iranian nuclear sites. The most significant upward move came on Tuesday, June 24, when reports of a Middle East cease-fire pushed Bitcoin up roughly 4%. At the time of writing, Bitcoin is trading at $106,330.
