Bitcoin Hits Rock Bottom? Bullish Signals Flash as Base Formation Sparks Recovery Rally

Has Bitcoin finally carved its bottom? The crypto king shows tentative signs of life after completing a textbook base formation—just as the 'buy the dip' crowd starts licking their chops.
Technical traders are circling
The 12% bounce off June lows smells like accumulation. Whales aren't dumping—they're reloading. Meanwhile, retail investors keep panic-selling at the worst possible moment (as usual).
Macro winds shifting?
With inflation data cooling and rate cuts back on the menu, risk assets are primed for a comeback. Bitcoin's historical volatility suggests we're either about to rocket or crash—no in-between.
Just remember: Wall Street still can't decide if crypto is 'digital gold' or a 'speculative asset'—but they'll happily charge you 2% to manage either.
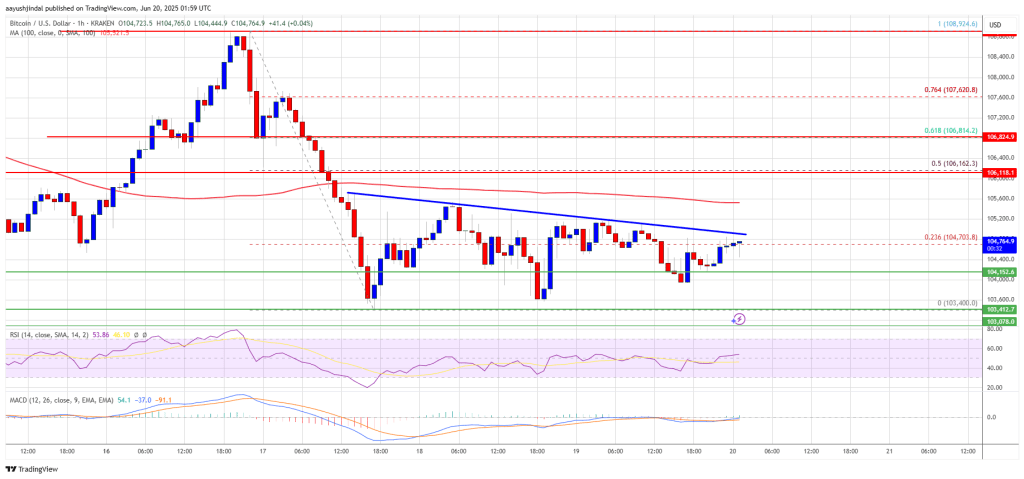
Bitcoin Price Faces Resistance
Bitcoin price started a fresh decline below the $107,500 zone. BTC gained pace and dipped below the $106,200 and $106,000 levels.
There was a clear MOVE below the $105,000 support level. Finally, the price tested the $103,500 zone. A low was formed at $103,400 and the price started a consolidation phase. It climbed above the 23.6% Fib retracement level of the downward move from the $108,925 swing high to the $103,400 low.
However, the bears were active below the $105,000 zone. Bitcoin is now trading below $105,000 and the 100 hourly Simple moving average. There is also a key bearish trend line forming with resistance at $104,850 on the hourly chart of the BTC/USD pair.
On the upside, immediate resistance is NEAR the $105,000 level. The first key resistance is near the $105,500 level. The next key resistance could be $106,150. It is near the 50% Fib retracement level of the downward move from the $108,925 swing high to the $103,400 low.
A close above the $106,150 resistance might send the price further higher. In the stated case, the price could rise and test the $108,000 resistance level. Any more gains might send the price toward the $108,800 level.
Another Drop In BTC?
If bitcoin fails to rise above the $105,000 resistance zone, it could start another decline. Immediate support is near the $104,150 level. The first major support is near the $103,500 level.
The next support is now near the $102,500 zone. Any more losses might send the price toward the $101,200 support in the near term. The main support sits at $100,000, below which BTC might gain bearish momentum.
Technical indicators:
Hourly MACD – The MACD is now losing pace in the bearish zone.
Hourly RSI (Relative Strength Index) – The RSI for BTC/USD is now above the 50 level.
Major Support Levels – $104,150, followed by $103,500.
Major Resistance Levels – $105,000 and $106,200.
