Dogecoin Awakens: Bullish Bottoming Pattern Sparks Crypto Comeback Hopes

Memecoin's Lazarus moment? Dogecoin flashes its first credible recovery signal since the 2024 crypto winter.
The Shiba Inu-themed asset - still down 89% from its 2021 ATH - just printed a textbook TD Sequential buy signal on weekly charts. Market makers are watching the $0.08 level like day traders watching a Robinhood notification.
Technical resurrection: DOGE's RSI coiled into oversold territory while exchange reserves hit 18-month lows - classic accumulation setup before the 2023 rally that made Elon tweet 'to the moon' unironically.
Warning: This is the same chart pattern that preceded last year's 40% dead-cat bounce before another 70% collapse. But hey, in crypto, hope springs eternal (until the next Fed meeting).
Dogecoin Prints Bullish Divergence
The most striking feature of the graphic is a sequence of regular bullish divergences—price sets progressively lower lows even as the RSI traces higher troughs. Cantonese Cat illustrates three such inflection points: the first in August 2024, the second in March and April 2025 and the latest in mid-June.
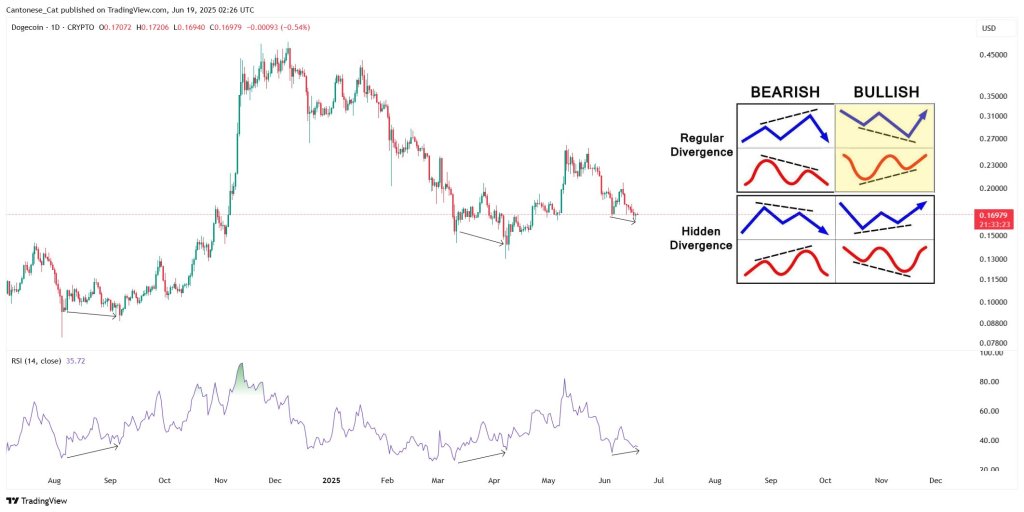
Historically, the first signal preceded the parabolic autumn rally that vaulted DOGE from the high-$0.05 area to an intraday peak just shy of $0.23, a nearly 300% advance. The March divergence ushered in a 100 percent rebound back to the $0.26 zone, a former support now acting as overhead resistance.
“DOGE daily – Bullish divergence with RSI,” Cantonese Cat wrote in his post, letting the annotated arrows speak louder than prose. A schematic inserted on the right-hand side of the chart underlines the textbook definition: in the highlighted quadrant, price slopes downward while momentum slopes upward, a configuration often interpreted as buyers quietly absorbing supply.
Descending Channel And Key Support Line
The current structural context lends weight to the signal. Since topping out in November above $0.48, price is retracing inside a descending channel. Within that broader channel, Dogecoin is now retesting a former down-sloping resistance line—which provided stiff resistance throughout March and April this year—that it finally broke in early May and is now acting as crucial support near $0.163.
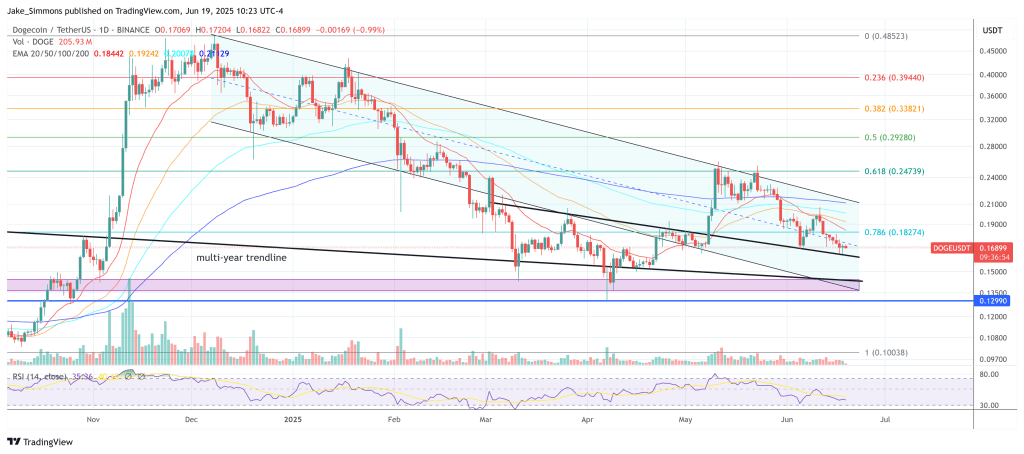
Just below this back-test sits the multi-year ascending trendline which now sits close to $0.142. Should both of those levels falter, the true lower boundary of the descending channel waits a fraction lower around $0.139, giving bulls only a narrow buffer of roughly three cents to defend.
From a Fibonacci perspective, the 0.786 retracement at $0.1826—coupled with the 20- and 50-day exponential moving averages as well as the channel midline at $0.172—forms the first ceiling that must be cleared to shift near-term momentum. A breakout above that area WOULD expose the 0.618 level at $0.247 and the 100-day EMA. Successive hurdles then stack at the 0.5 retracement ($0.292), the 0.382 ($0.338), and the 0.236 ($0.3939), each corresponding to prior congestion zones during the winter advance.
Volume has begun to taper as price approaches support, while the 14-period RSI remains anchored in the mid-30s—still technically oversold, but showing a slight uptick that mirrors the bullish divergence Cantonese Cat flagged. For bears, a decisive daily close beneath the multi-year trendline would invalidate that divergence setup and likely drive DOGE toward the horizontal liquidity band between $0.135 and $0.13, with a final capitulation target around $0.10—site of last October’s base.
