XRP Price Teeters on Critical Support — Will Bulls Defend the Line for a June 2025 Rally?

XRP dances on the knife's edge as market watchers hold their breath.
Support or surrender? The crypto's next move hinges on this make-or-break level.
Technical battleground: While traders obsess over charts, Wall Street still can't decide if crypto is 'digital gold' or a gambling addiction wrapped in blockchain.
All eyes on the weekly close — because in this market, hope springs eternal until the stop-losses get triggered.
XRP Price Holds Support
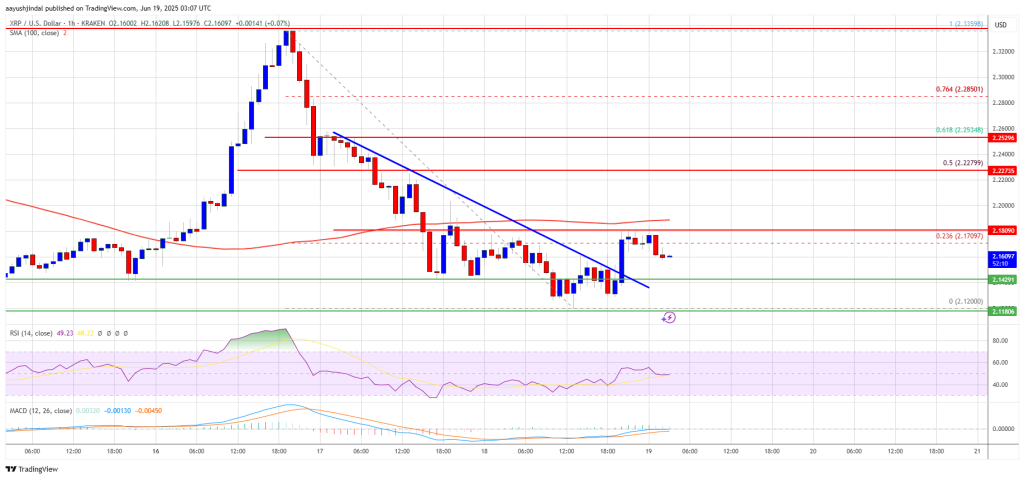
XRP price reacted to the downside below the $2.220 support zone, like Bitcoin and Ethereum. The price declined below the $2.20 and $2.180 support levels.
The pair tested the $2.120 support A low was formed at $2.120 and the price is now consolidating losses. There was a minor MOVE above the 23.6% Fib retracement level of the recent decline from the $2.335 swing high to the $2.120 low.
Besides, there was a break above a bearish trend line with resistance at $2.1550 on the hourly chart of the XRP/USD pair. The price is now trading below $2.20 and the 100-hourly Simple Moving Average.
On the upside, the price might face resistance NEAR the $2.180 level. The first major resistance is near the $2.20 level. The next resistance is $2.2250 or the 50% Fib retracement level of the recent decline from the $2.335 swing high to the $2.120 low.
A clear move above the $2.2250 resistance might send the price toward the $2.2540 resistance. Any more gains might send the price toward the $2.280 resistance or even $2.30 in the near term. The next major hurdle for the bulls might be $2.350.
Another Decline?
If XRP fails to clear the $2.20 resistance zone, it could start another decline. Initial support on the downside is near the $2.1420 level. The next major support is near the $2.120 level.
If there is a downside break and a close below the $2.120 level, the price might continue to decline toward the $2.050 support. The next major support sits near the $2.020 zone.
Technical Indicators
Hourly MACD – The MACD for XRP/USD is now losing pace in the bearish zone.
Hourly RSI (Relative Strength Index) – The RSI for XRP/USD is now near the 50 level.
Major Support Levels – $2.1420 and $2.120.
Major Resistance Levels – $2.180 and $2.20.
