RAY, AERO, SPX Defy Crypto Chaos: 3 Tokens Post Double-Digit Gains Amid Market Turmoil

Crypto markets tanked—but these three tokens laughed all the way to the blockchain.
Defying Gravity (and Common Sense)
While Bitcoin wobbled and ETH bled, RAY, AERO, and SPX ripped double-digit gains this week. No major catalysts—just the usual crypto voodoo where some coins moon because… well, somebody hit ‘buy.’
Institutions Hate This One Trick
Retail traders piled into these altcoins like Wall Streeters into a cocaine buffet. SPX’s surge came despite zero protocol upgrades—proving once again that fundamentals are optional in crypto-land.
The Punchline?
Another day, another reminder that digital assets dance to their own erratic rhythm. Meanwhile, traditional finance bros still can’t decide if this is ‘the future of money’ or a Ponzi scheme. Place your bets.
Raydium springs back from $2
Raydium trades in the green by over 15% at press time on Thursday, as it bounces off the $2.00 psychological support level. The price action offers a double bottom reversal on the daily chart with a neckline at $2.58.
A clean push closing above the neckline could turbocharge Raydium’s recovery toward the 200-day Exponential Moving Average (EMA) at the $3.00 round figure.
The Moving Average Convergence/Divergence (MACD) indicator reverses upside and flashes a buy signal as it surpasses its signal line, known as a bullish crossover. The growth of a positive histogram from the zero line signals potential trend reversal in Raydium.
The Relative Strength Index (RSI) at 50 has spiked to the halfway level from the oversold zone, signaling a boost in bullish momentum.
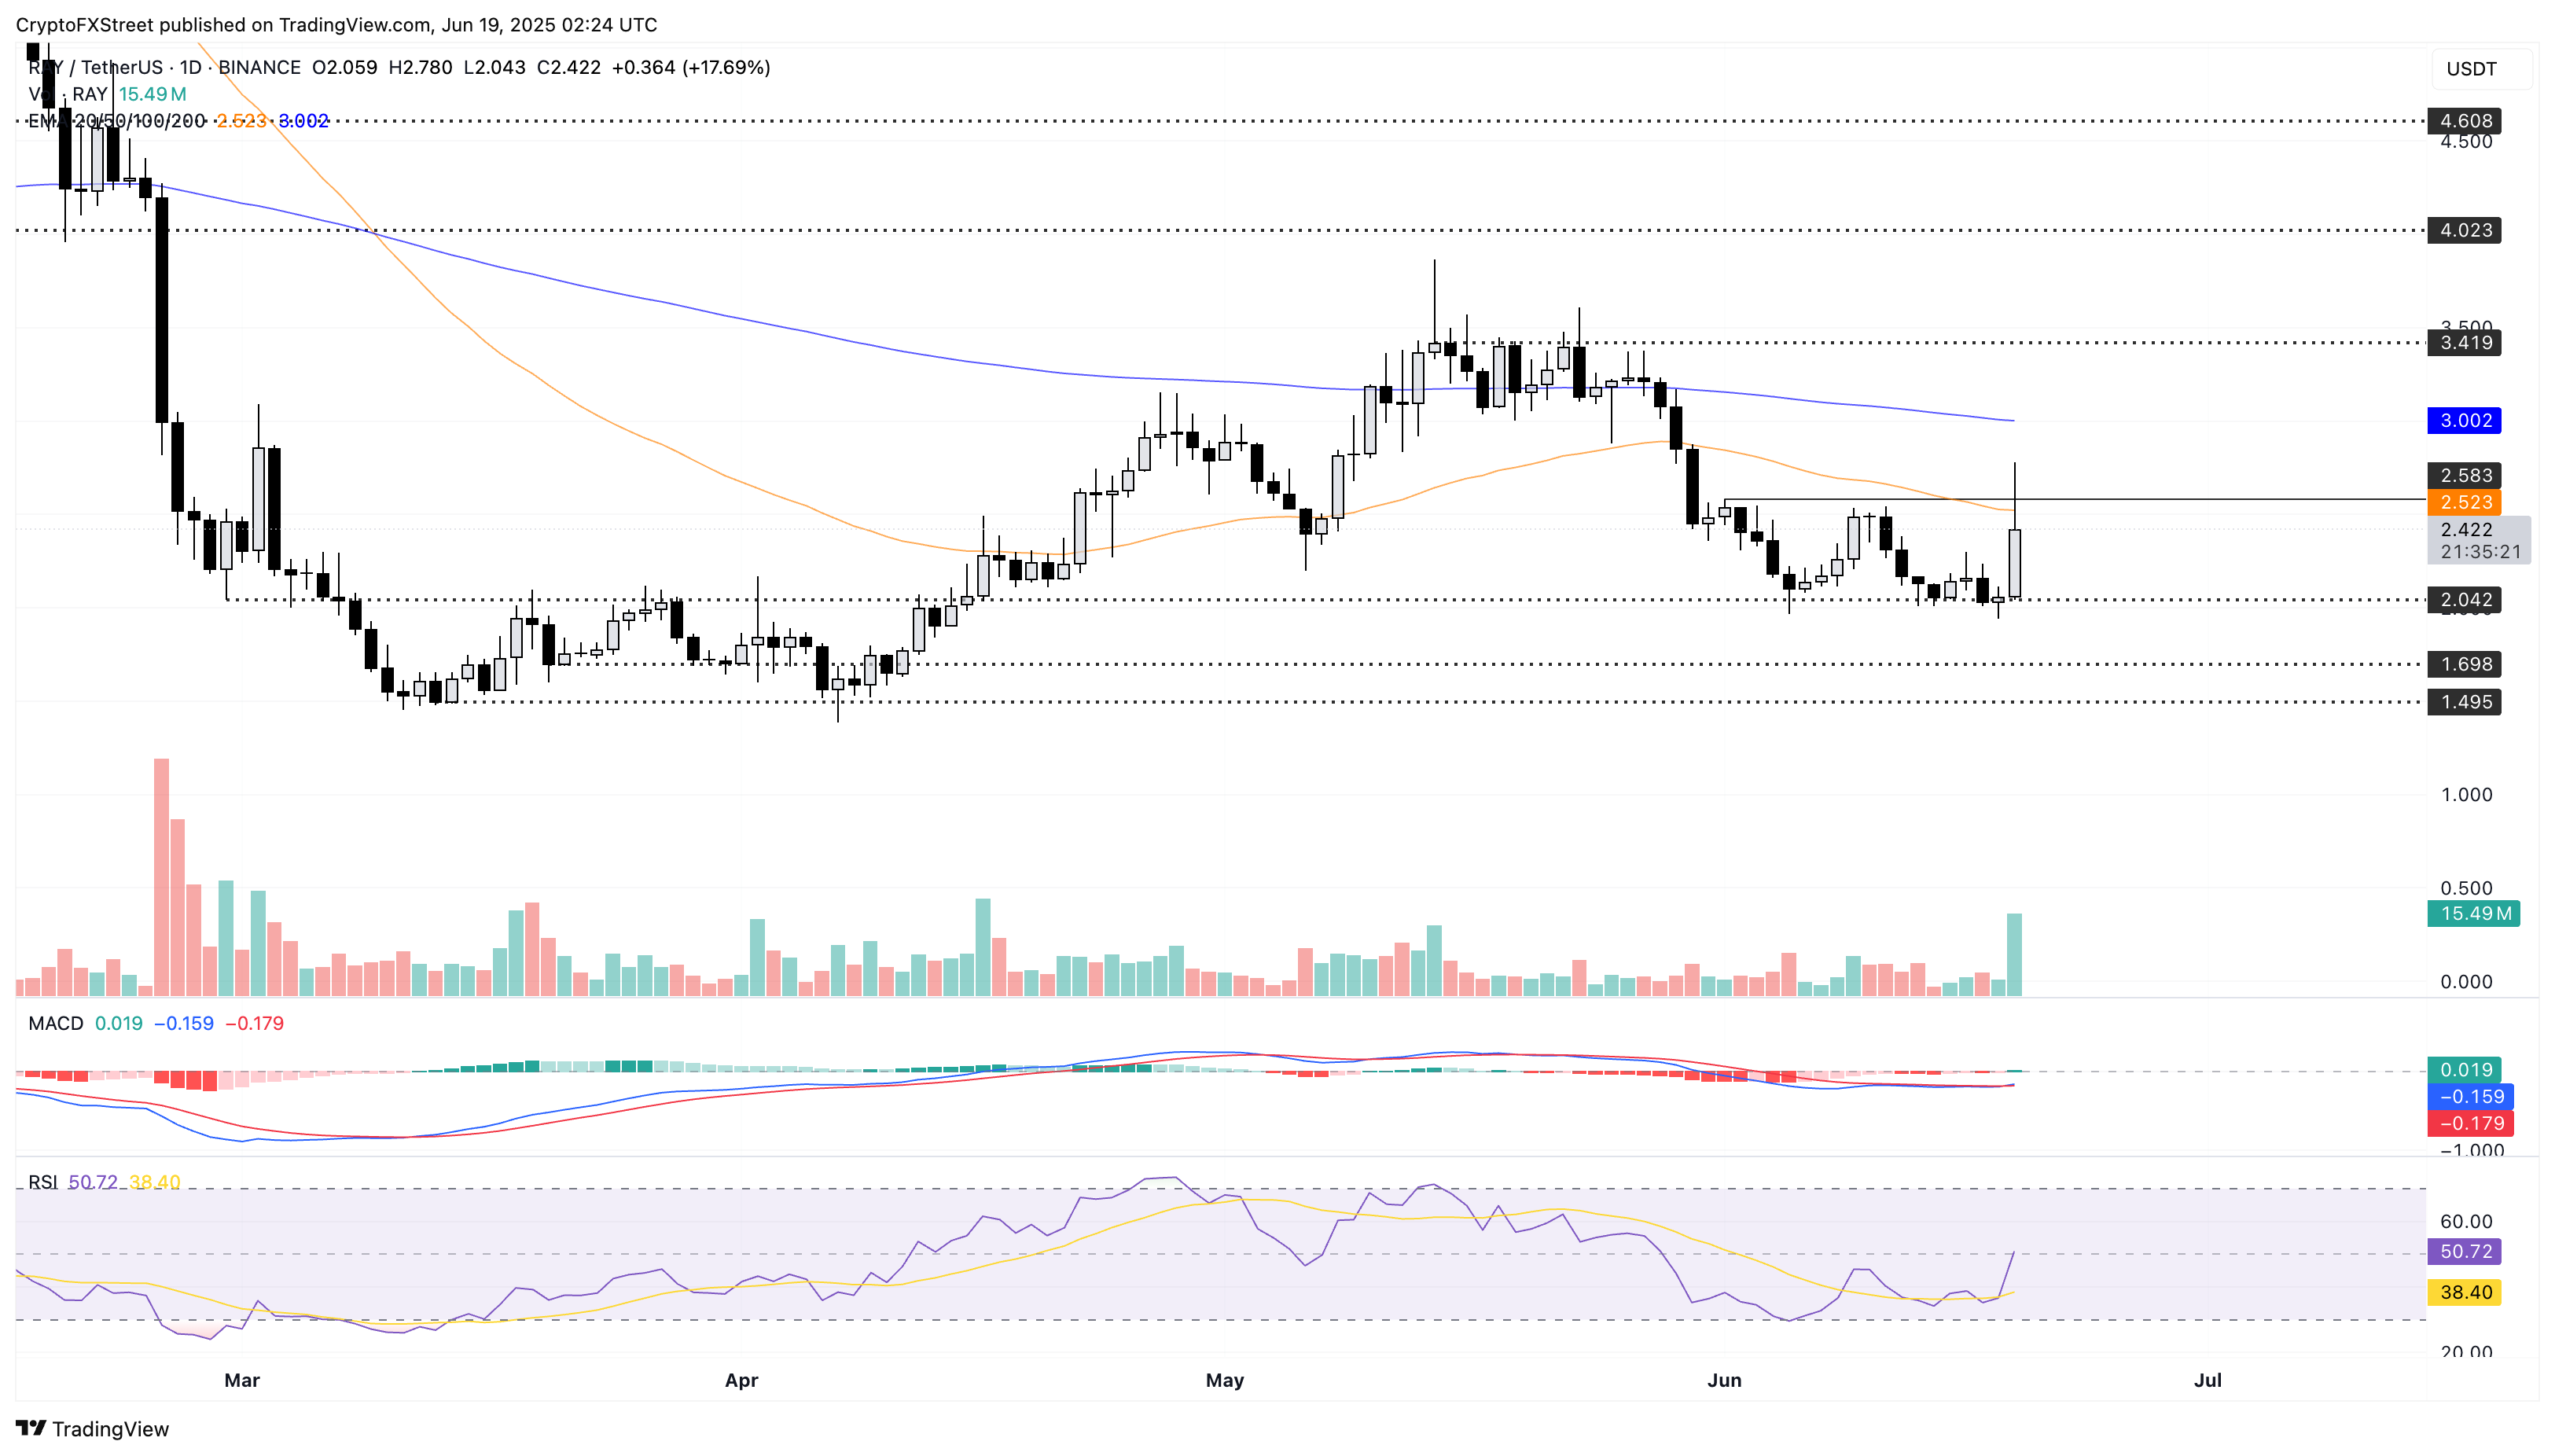
RAY/USDT daily price chart.
On the contrary, a failure to close above the double bottom’s neckline could revert RAY towards the $2.00 mark.
AERO targets extended gains towards $1
AERO edges higher by 3% at the time of writing, following the previous day’s 19% surge. The DeFi token surpasses the 200-day (EMA) and records its highest traded price in over four months.
AERO marks a concrete closing above $0.81 aligned with the 50% Fibonacci level, drawn from the all-time high of $2.33 to the year-to-date low of $0.282. The immediate resistance lies at $1.04, aligned with the 61.8% Fibonacci level.
The positive trend in the MACD indicator, with rising green histograms, indicates a strengthening of bullish momentum. However, the RSI line nears the overbought zone, gradually increasing the risk of a pullback.
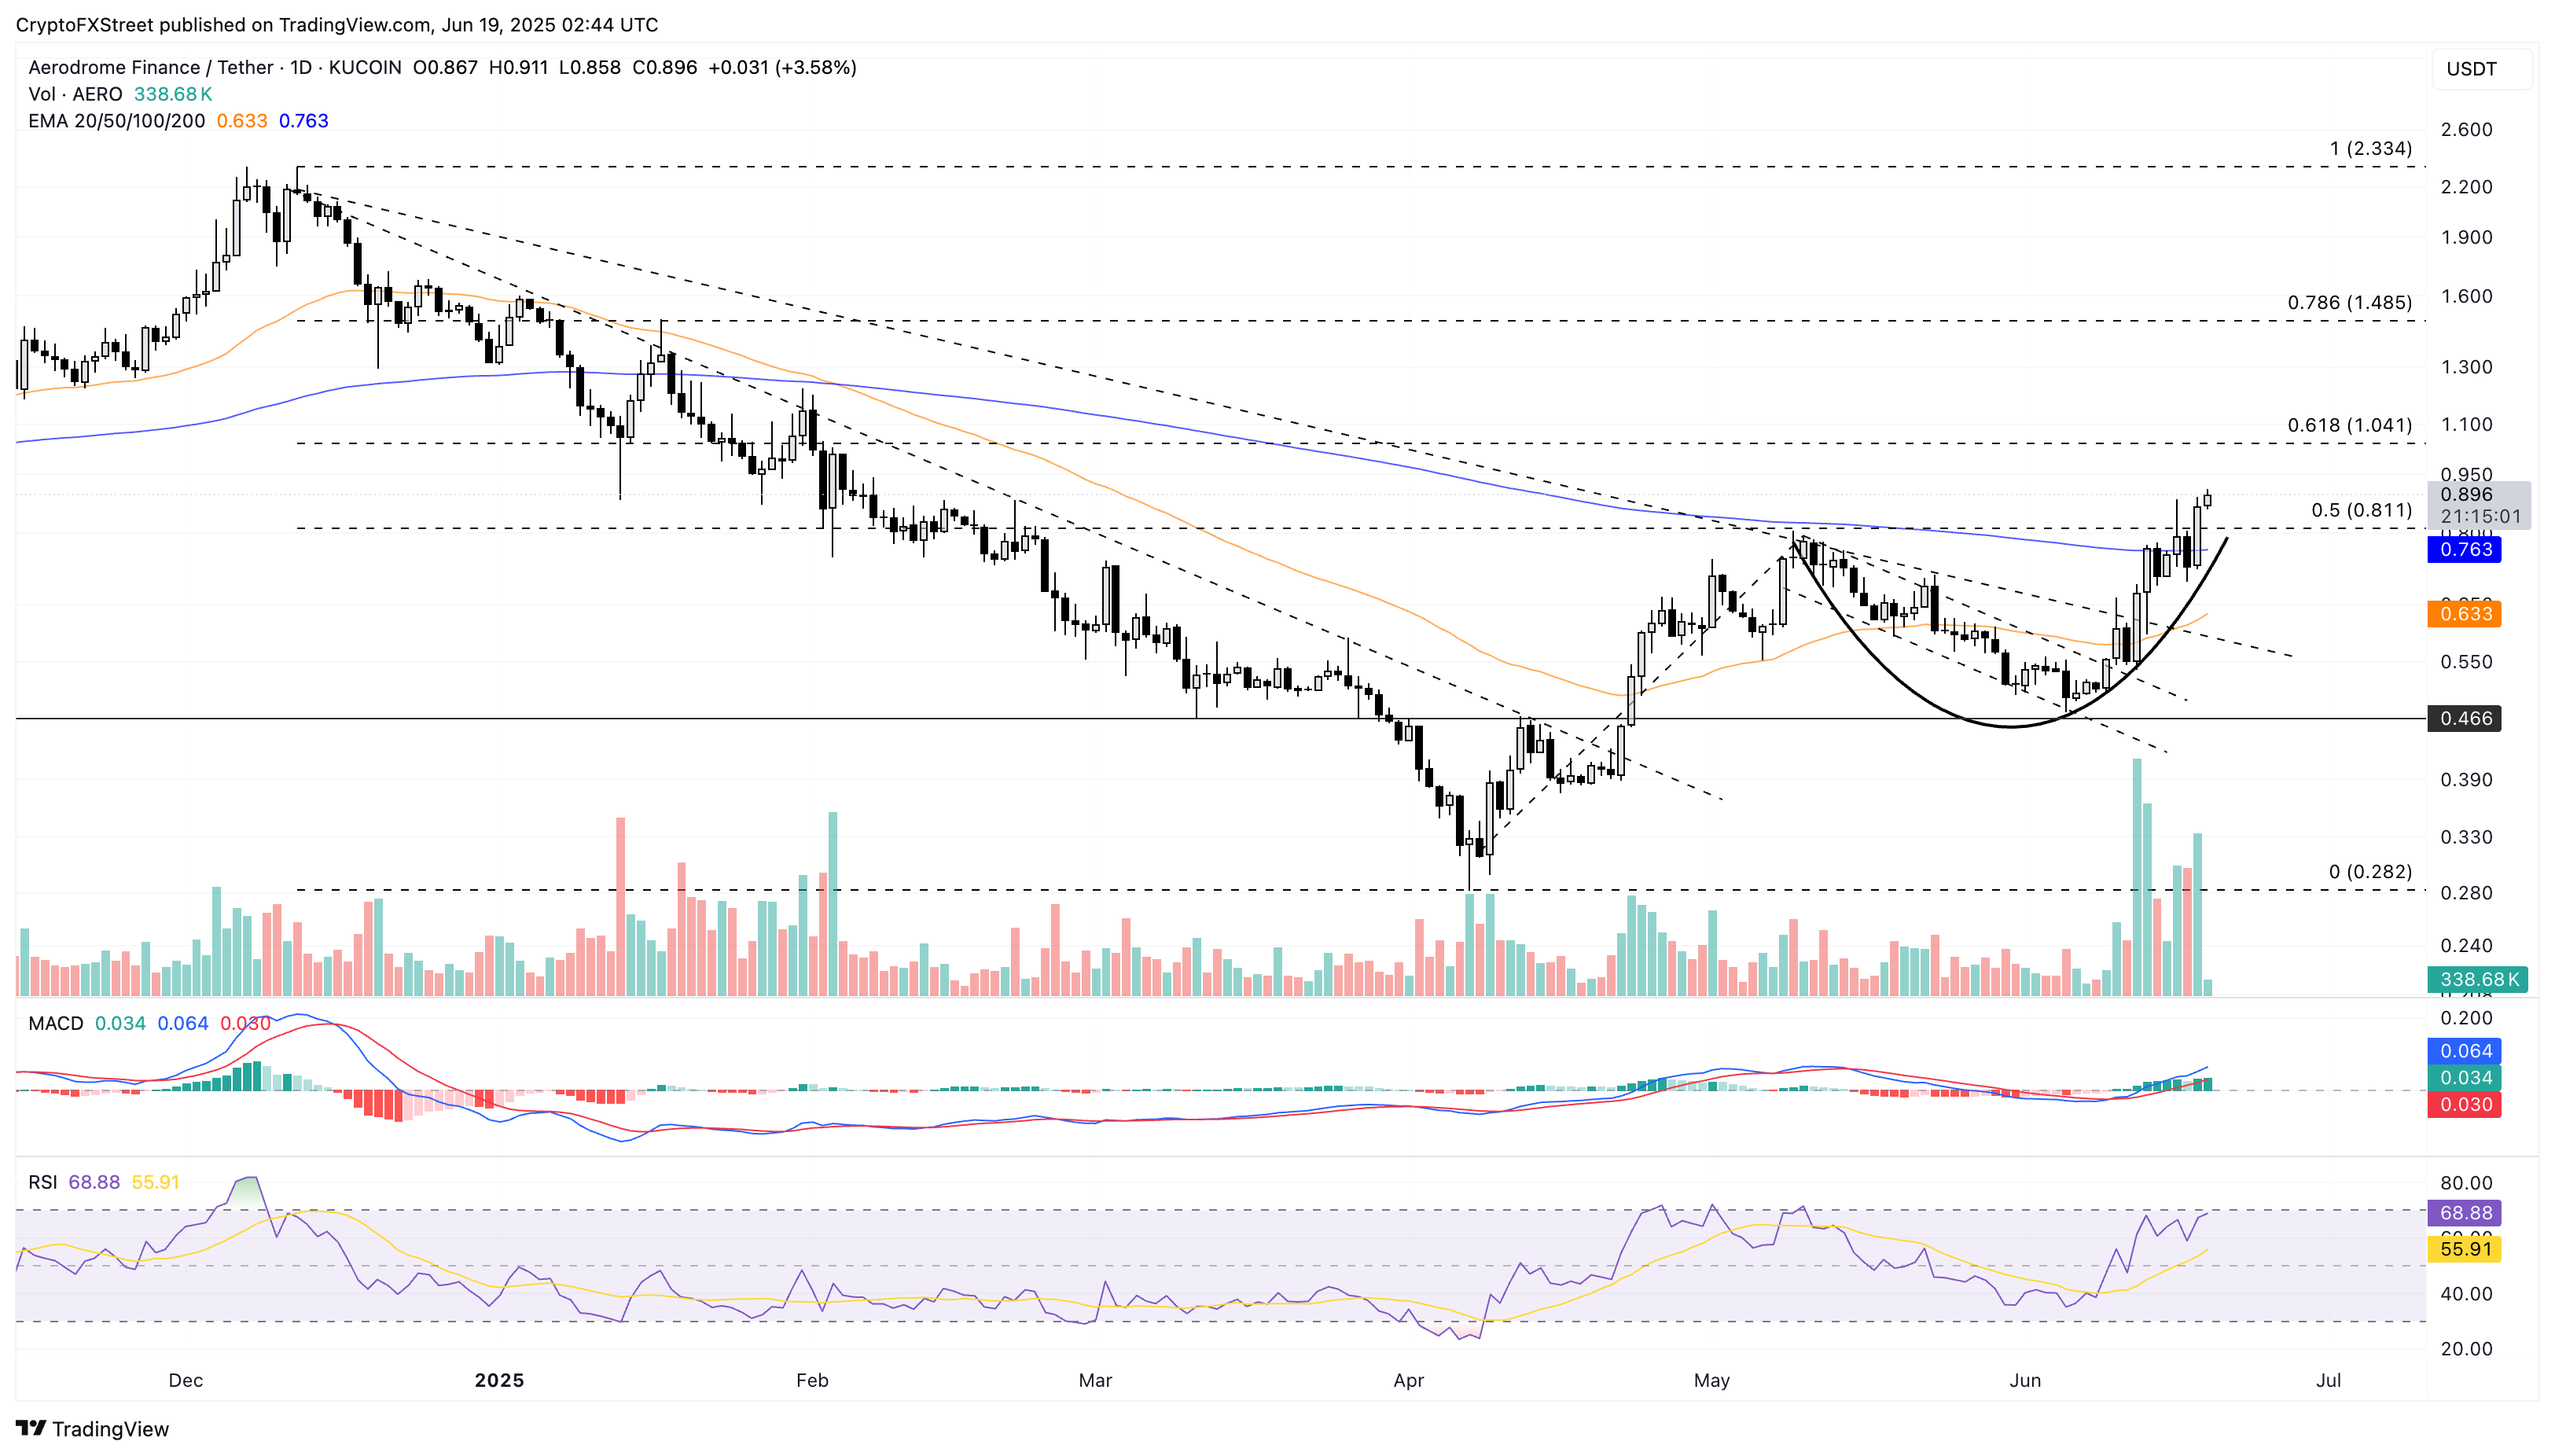
AERO/USDT daily price chart.
On the flip side, a reversal below the 50% Fibonacci could nullify upside chances, risking a 50-day EMA retest at $0.63.
SPX recovery warns of a dead cat bounce performance
In a show of underlying strength, the SPX6900 meme coin surged by 13% on Wednesday, undermining the previous day’s 12% pullback. At the time of writing, SPX edges lower by over 1% on Thursday, indicating a breather phase.
The meme coin faces opposition at the $1.47 support level, aligned with the 78.6% Fibonacci retracement drawn from the all-time high of $8.03 to the year-to-date low of $0.25. Closing above this could drive SPX toward its all-time high.
However, the increased volatility since last week triggers a bearish crossover in the MACD indicator as it drops below its signal line. A new wave of red histogram bars below the zero line indicates a looming trend reversal.
Similarly, the RSI at 59, reversing from the overbought zone, indicates a loss of bullish momentum.
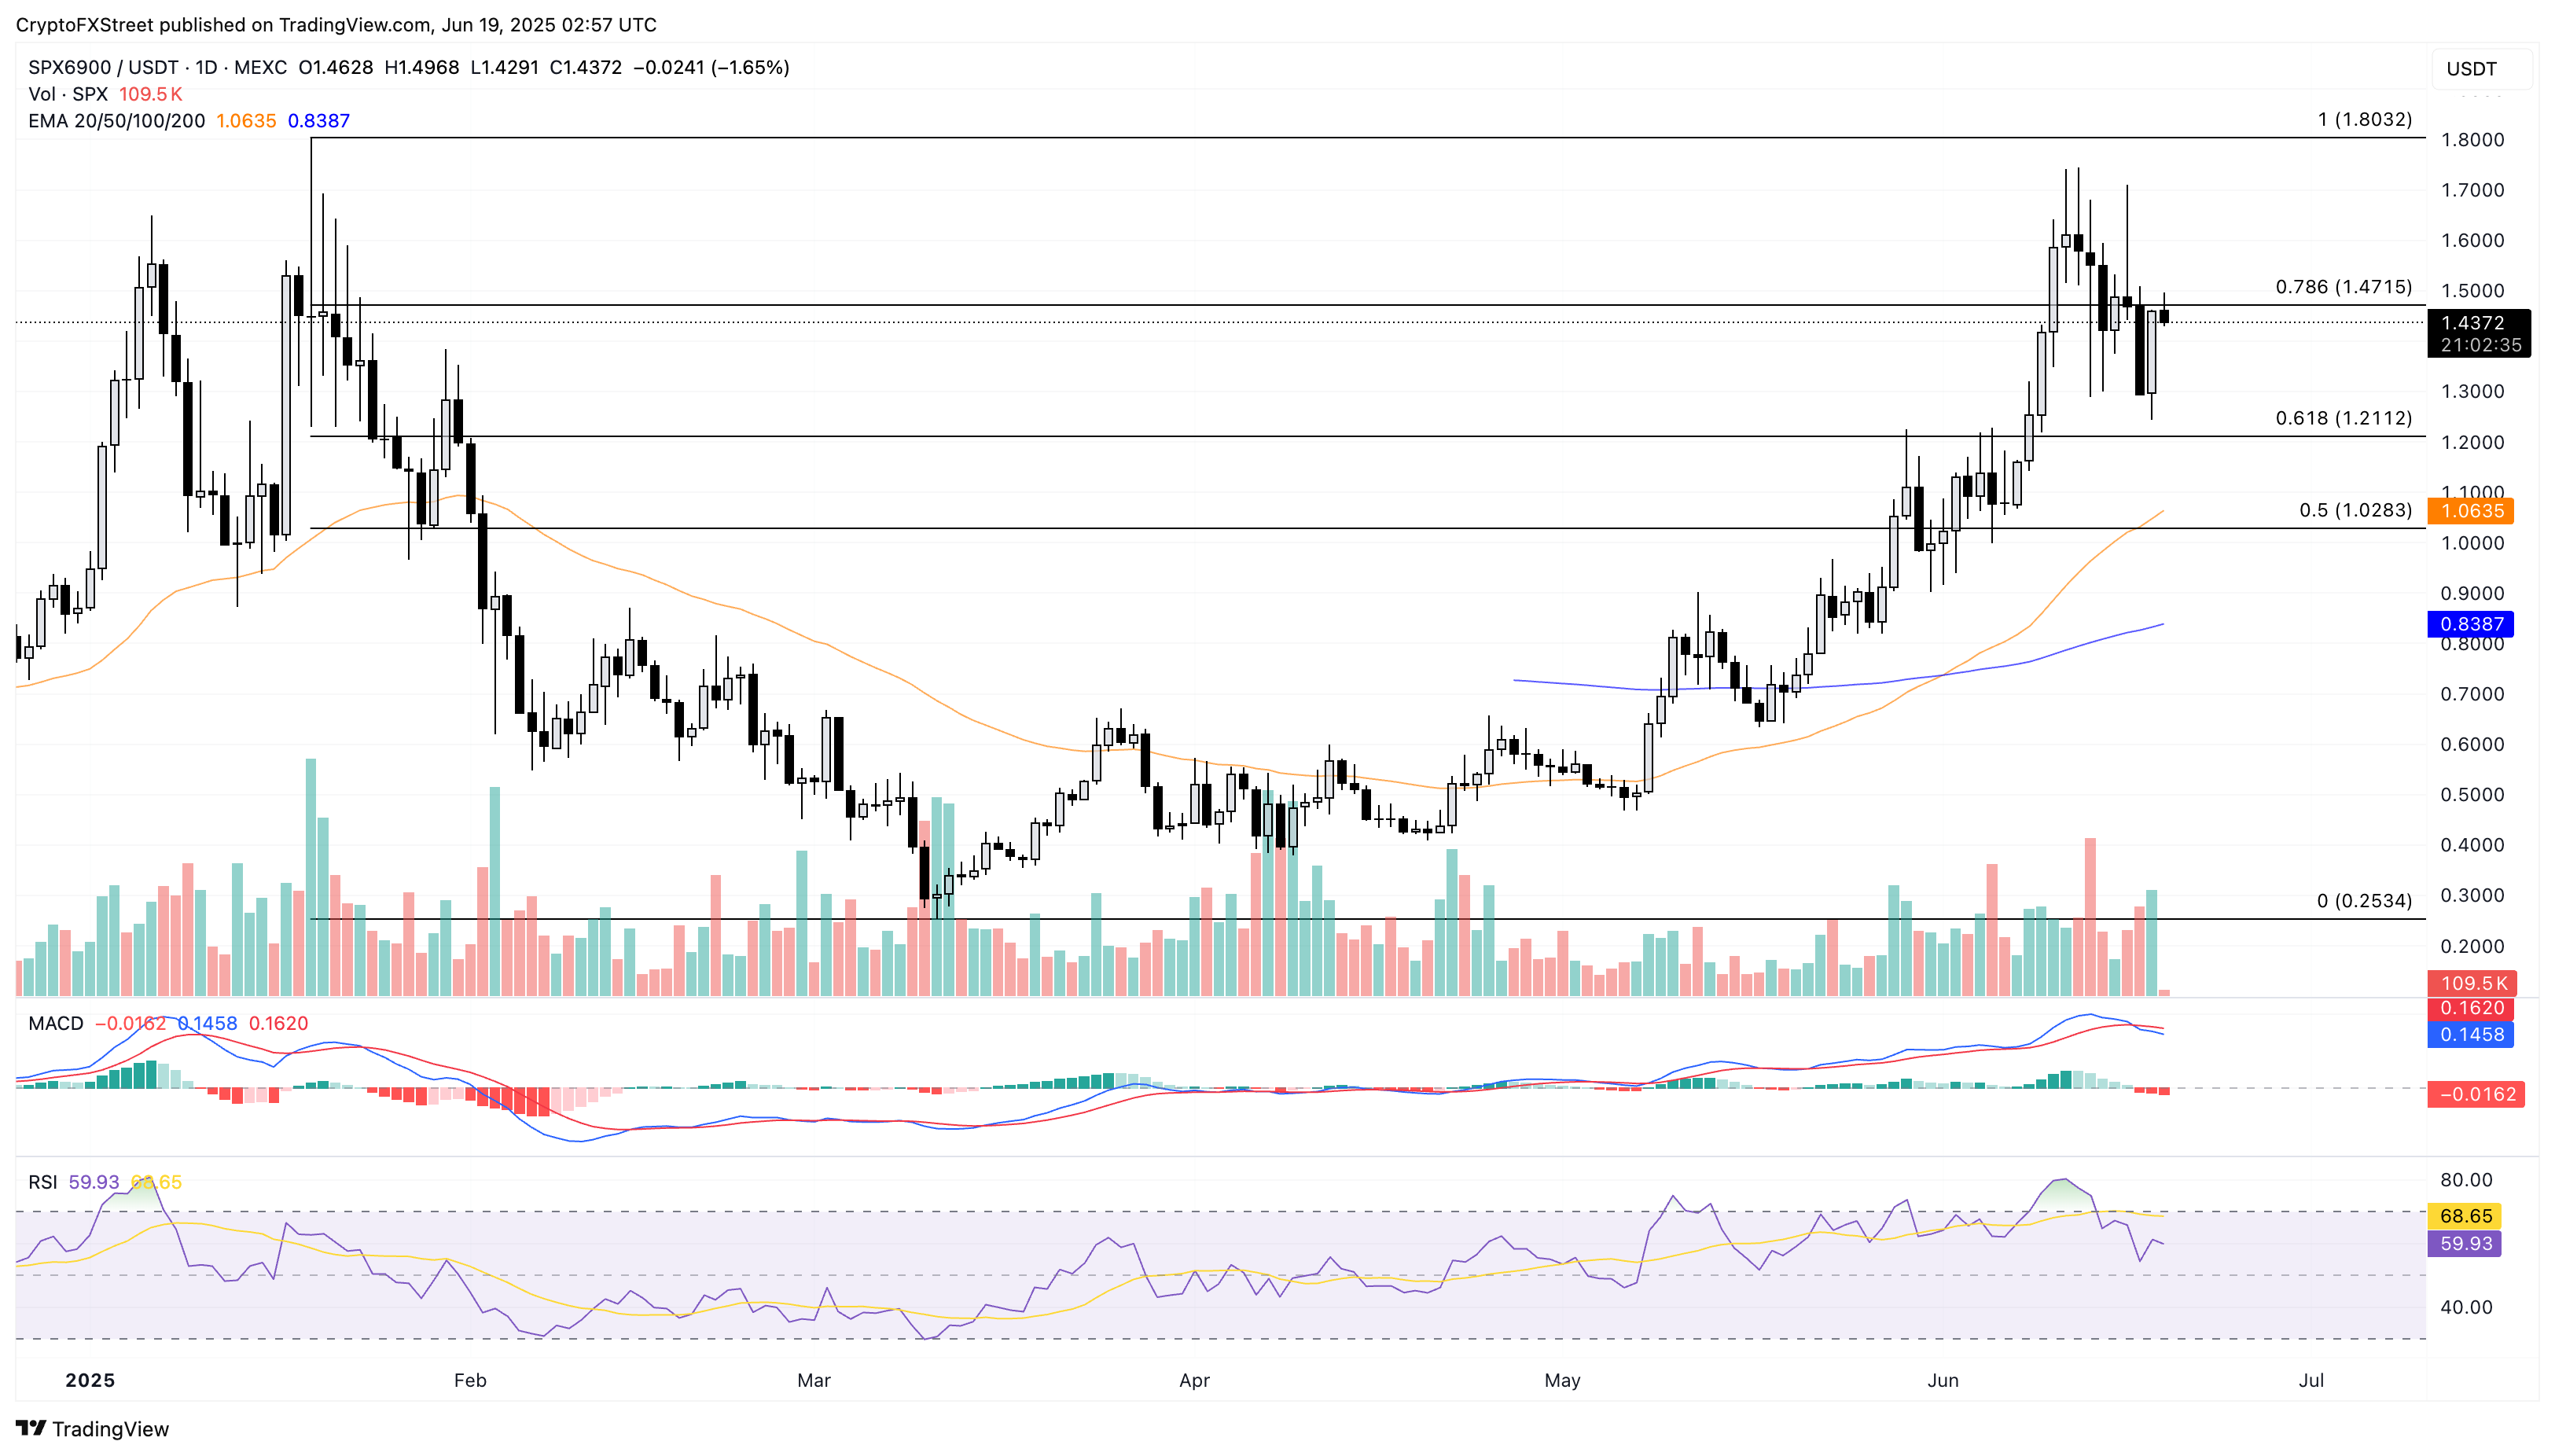
SPX/USDT daily price chart.
A bullish failure to cross above $1.47 could drop SPX towards the 61.8% Fibonacci level at $1.21.
