Bitcoin Bulls Dig In: BTC Hovers Near All-Time High as Traders Eye Breakout

Bitcoin’s price action tightens like a coiled spring—consolidating just shy of its record peak. The crypto king isn’t just knocking on resistance’s door; it’s rattling the hinges.
Market mechanics at play
With every sideways candle, the pressure builds. Liquidity pools cluster above current levels, tempting both breakout algos and old-school traders chasing confirmation bias. Meanwhile, Wall Street’s latest ’crypto-convert’ analysts scramble to justify their sudden bullishness—right on schedule, as always.
What comes next?
Either we get the mother of all bull traps or a proper march toward six figures. One thing’s certain: when BTC finally picks a direction, the move will be violent enough to liquidate overleveraged degens on both sides. Buckle up.
Bitcoin Price Sets New ATH
Bitcoin price started a fresh increase from the $105,000 support zone. BTC formed a base and was able to clear the $108,000 resistance zone. The bulls pushed the price above $110,000.
The bulls even pumped the price above the $111,500 resistance zone. The price traded to a new all-time high NEAR $111,980 and is currently consolidating gains above the 23.6% Fib retracement level of the upward move from the $104,270 swing low to the $111,980 high.
Bitcoin is now trading above $109,000 and the 100 hourly Simple moving average. There is also a key bullish trend line forming with support at $110,000 on the hourly chart of the BTC/USD pair.
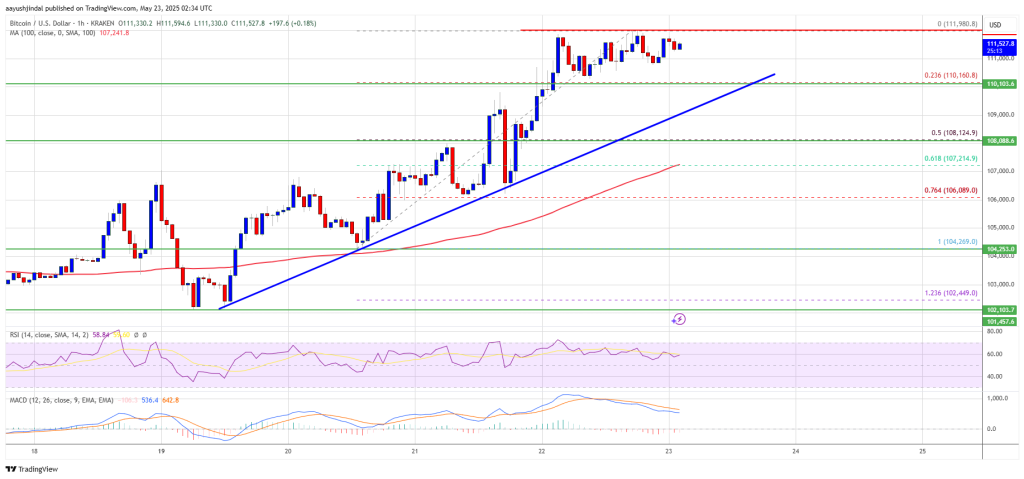
On the upside, immediate resistance is near the $112,000 level. The first key resistance is near the $112,500 level. The next key resistance could be $113,200. A close above the $113,200 resistance might send the price further higher. In the stated case, the price could rise and test the $115,000 resistance level. Any more gains might send the price toward the $118,000 level.
Are Dips Supported In BTC?
If Bitcoin fails to rise above the $112,000 resistance zone, it could start another correction. Immediate support on the downside is near the $110,000 level and the trend line. The first major support is near the $108,200 level and the 50% Fib retracement level of the upward move from the $104,270 swing low to the $111,980 high.
The next support is now near the $107,200 zone. Any more losses might send the price toward the $106,000 support in the near term. The main support sits at $105,000, below which BTC might gain bearish momentum.
Technical indicators:
Hourly MACD – The MACD is now gaining pace in the bullish zone.
Hourly RSI (Relative Strength Index) – The RSI for BTC/USD is now above the 50 level.
Major Support Levels – $110,000, followed by $108,200.
Major Resistance Levels – $112,000 and $113,200.
