Bitcoin’s Golden Cross Looms – Here’s What Traders Should Do Now

Bitcoin’s flirting with a bullish golden cross—and analysts are scrambling to update their playbooks. Here’s the smart money move while Wall Street still thinks ’blockchain’ is a type of salad.
When the 50-day MA punches above the 200-day, history suggests fireworks. But this isn’t 2021’s meme-stock carnival. Veteran traders are watching volume and leverage ratios like hawks.
The real test? Whether this technical pattern survives contact with macroeconomics—because nothing tanks crypto faster than Jerome Powell’s coffee order.
Analyst Disputes Golden Cross Hype As Late Signal
In a recent analysis published on TradingView, FX_Professor discussed a different take on Bitcoin’s golden cross. While most market commentators interpret this crossover of the 50-day simple moving average above the 200-day as a strong bullish confirmation, the analyst dismissed it as a delayed indicator. The analyst described it as the afterparty where retail investors arrive late to the scene.
Instead of waiting for the golden cross to flash green, FX_Professor noted pre-indicator pressure zones as the real signal of value. In the case of Bitcoin’s price action in recent months, the analyst pointed out the $74,394 and $79,000 region as the zone of accumulation and early positioning, well before the golden cross became visible. As such, by the time the cross appeared recently, Bitcoin’s price action had already been up significantly.
The golden cross is often used by traders as a signal to enter a long position, as it suggests that the asset’s price is likely to continue rising. However, this analysis follows a trend among experienced traders who view the golden cross as more of a lagging confirmation than a trigger of a rally.
Early Entry Zones And Structure Matter More, Analyst Says
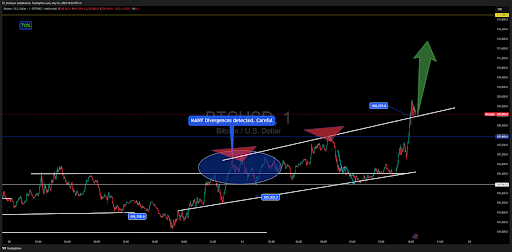
According to FX_Professor, indicators such as EMAs or SMAs can be useful but should never come before understanding the price structure, trendlines, and real-time pressure zones. He shared a snapshot of his own Bitcoin price chart that combines custom EMAs with a signature parallelogram method to detect where price tension begins to build. Visible on the chart are entries forming as early as April when Bitcoin bounced off support around $74,000, long before the crossover confirmation.
Now, with bitcoin pushing toward the next target zone near $113,000, the analyst’s strategy continues to validate itself in real time. Nonetheless, the confirmation of a golden cross is still bullish for Bitcoin’s price action moving forward, even if the price rally is already halfway to its peak level.
At the time of writing, Bitcoin is trading at $110,734. This marks a slight pullback from the new all-time high of $111,544, which was registered just three hours ago. The bitcoin price is still up by 3.1% in the past 24 hours, and new all-time highs are possible before the weekly close.
