Bitcoin at a Crossroads: Bull Run or Bear Trap? Key Price Levels Every Crypto Trader Needs to Know

Bitcoin’s price action has traders split—is this the start of a new rally or another fakeout before the plunge? One analyst cuts through the noise with make-or-break levels that could decide BTC’s fate.
The Bull Case: Holding above $65K keeps the dream alive. A clean break past $71K and we’re flirting with new ATHs—just in time for Wall Street to pretend they invented blockchain.
The Bear Trap: If support at $60K cracks, prepare for the usual chorus of ’I told you so’ from gold bugs and bank CEOs. Next stop? The dreaded $52K liquidity zone where leverage longs go to die.
Meanwhile, institutional traders are placing bets both ways—because why pick a side when you can profit from volatility and still collect management fees?
Mixed Signals: Why the Current Resistance Zone Is Critical
Crypto analyst Tony “The Bull” Severino shared a chart and in-depth breakdown on the social media platform X, pointing to horizontal support and resistance levels as the most important technical indicators in his view. As shown on his Bitcoin weekly chart, the leading cryptocurrency is now pressing against a well-defined resistance zone just below its all-time high, marked clearly in red. The proximity of this level to its all-time high means it could act as a ceiling, making it an important area to watch for either a breakout or a reversal.
Tony outlines three possible interpretations for the current market structure around the $108,000 resistance level. The bullish case hinges on bitcoin consolidating under resistance, a pattern often followed by upward continuation. The neutral case is that Bitcoin could be forming a broad trading range, in which case it makes sense to short the market at resistance while buying near support. On the bearish side, the presence of a doji candlestick at this key level may be a sign of fading momentum and an early signal of a price reversal.
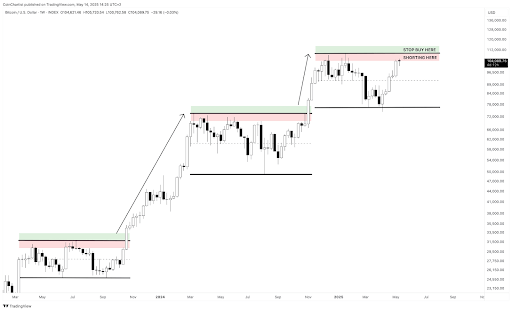
His trading strategy reflects this uncertainty. He has placed short positions within the red resistance zone, with a stop loss just above the all-time high. At the same time, he has set a stop buy order in the green breakout zone above the all-time high, ready to switch long should the bitcoin price convincingly break through resistance.
Conditions For A Bullish Breakout Are Not Yet Fulfilled
Although Tony noted that the broader investment market, including altcoins and the stock market, looks strong, he cautioned that this does not guarantee a bullish breakout for Bitcoin. For confirmation, a bullish breakout must be preceded by aligning various technical indicators. These include a breakout with substantial trading volume, an RSI reading above 70 on the weekly chart, and a weekly close above the upper Bollinger Band.
At the moment, however, the Bitcoin CME Futures chart has failed to MOVE past 70 on the daily RSI twice, and trading volume is in decline. According to CoinMarketCap, the trading volume of Bitcoin is $44.33 billion in the past 24 hours, a 11.40% reduction from the previous 24 hours. These are early warning signs that a breakout attempt may lack the strength needed for sustainability.
Nonetheless, the conditions are still very mixed and starting to lean more bullish than bearish. At the time of writing, Bitcoin is trading at $102,352, down by 1.31% in the past 24 hours.
