XRP Teeters at Critical Support — Will the 100 SMA Trigger a Rally or Another Faceplant?

XRP dances on the knife’s edge of its key support level as traders hold their breath. The 100-day Simple Moving Average (SMA) looms—technical purists swear it’ll spark a rebound, while skeptics note the crypto’s uncanny ability to disappoint right when optimism peaks.
Market sentiment? Split like a fork in the blockchain. Bulls point to oversold conditions and whisper about ’accumulation zones.’ Bears counter with regulatory deja vu and the cold reality that 90% of ’key levels’ eventually break—usually right after your leveraged long position triggers.
One hedge fund quant (who requested anonymity because ’my compliance department has a sense of humor’) quipped: ’Trading XRP is like betting on a racehorse that keeps stopping to check its Twitter mentions.’ The 100 SMA might matter... until the SEC or a whale wallet decides it doesn’t.
XRP Price Dips To Support
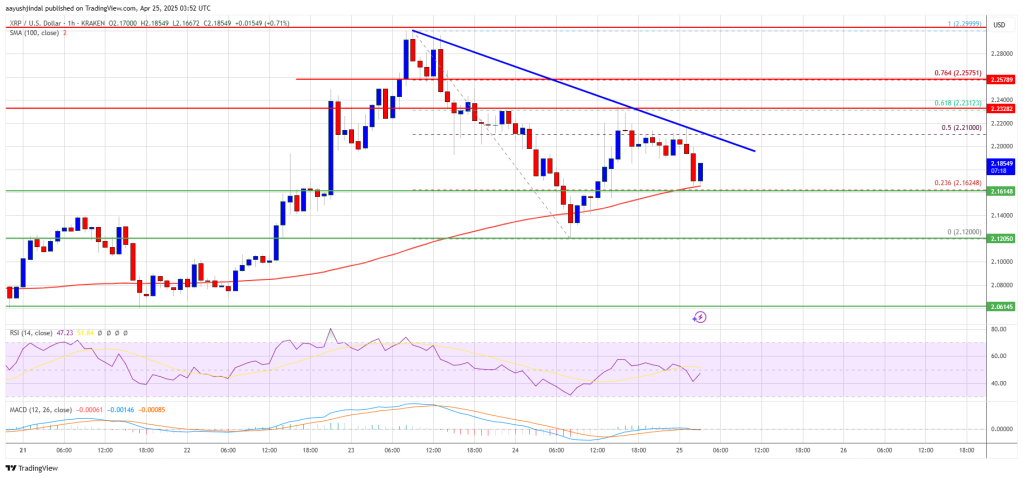
XRP price started a decent upward wave above the $2.120 and $2.150 resistance levels, like Bitcoin and Ethereum. The price traded above the $2.220 and $2.250 levels to start a decent increase.
A high was formed at $2.299 and the price started a downside correction. There was a move below the $2.20 and $2.180 support levels. A low was formed at $2.120 and the price started another increase. It cleared the 50% Fib retracement level of the downward move from the $2.299 swing high to the $2.120 low.
However, the bears are active near the $2.2350 level and the 61.8% Fib retracement level of the downward move from the $2.299 swing high to the $2.120 low. There is also a key bearish trend line forming with resistance at $2.20 on the hourly chart of the XRP/USD pair.
The price is now trading above $2.150 and the 100-hourly Simple Moving Average. On the upside, the price might face resistance near the $2.20 level and the trend line. The first major resistance is near the $2.2350 level.
The next resistance is $2.30. A clear move above the $2.30 resistance might send the price toward the $2.350 resistance. Any more gains might send the price toward the $2.450 resistance or even $2.50 in the near term. The next major hurdle for the bulls might be $2.620.
More Downsides?
If XRP fails to clear the $2.20 resistance zone, it could start another decline. Initial support on the downside is near the $2.1620 level. The next major support is near the $2.150 level.
If there is a downside break and a close below the $2.150 level, the price might continue to decline toward the $2.120 support. The next major support sits near the $2.0650 zone.
Technical Indicators
Hourly MACD – The MACD for XRP/USD is now losing pace in the bullish zone.
Hourly RSI (Relative Strength Index) – The RSI for XRP/USD is now below the 50 level.
Major Support Levels – $2.1650 and $2.150.
Major Resistance Levels – $2.200 and $2.2350.
