Ethereum’s Golden Cross Triggers Bullish Frenzy – Time to Buy or Just Another Crypto Mirage?

Ethereum just flashed its first golden cross since the 2024 bull run—a technical signal that’s got traders scrambling for their buy orders. The 50-day MA sliced through the 200-day like a hot knife through institutional FUD.
But here’s the real question: Will this chart pattern actually deliver gains, or is it just another false prophet in crypto’s temple of hopium? Past golden crosses have preceded 30%+ rallies, but let’s not forget Wall Street’s golden rule: ’Technical analysis works until it doesn’t.’
With ETH hovering near $4,000 and gas fees still high enough to make a banker blush, this could be the start of a major breakout—or just another opportunity for whales to dump on retail. The market’s pricing in 80% odds of ETF approval by June. Place your bets.
Ethereum Flashes Golden Cross
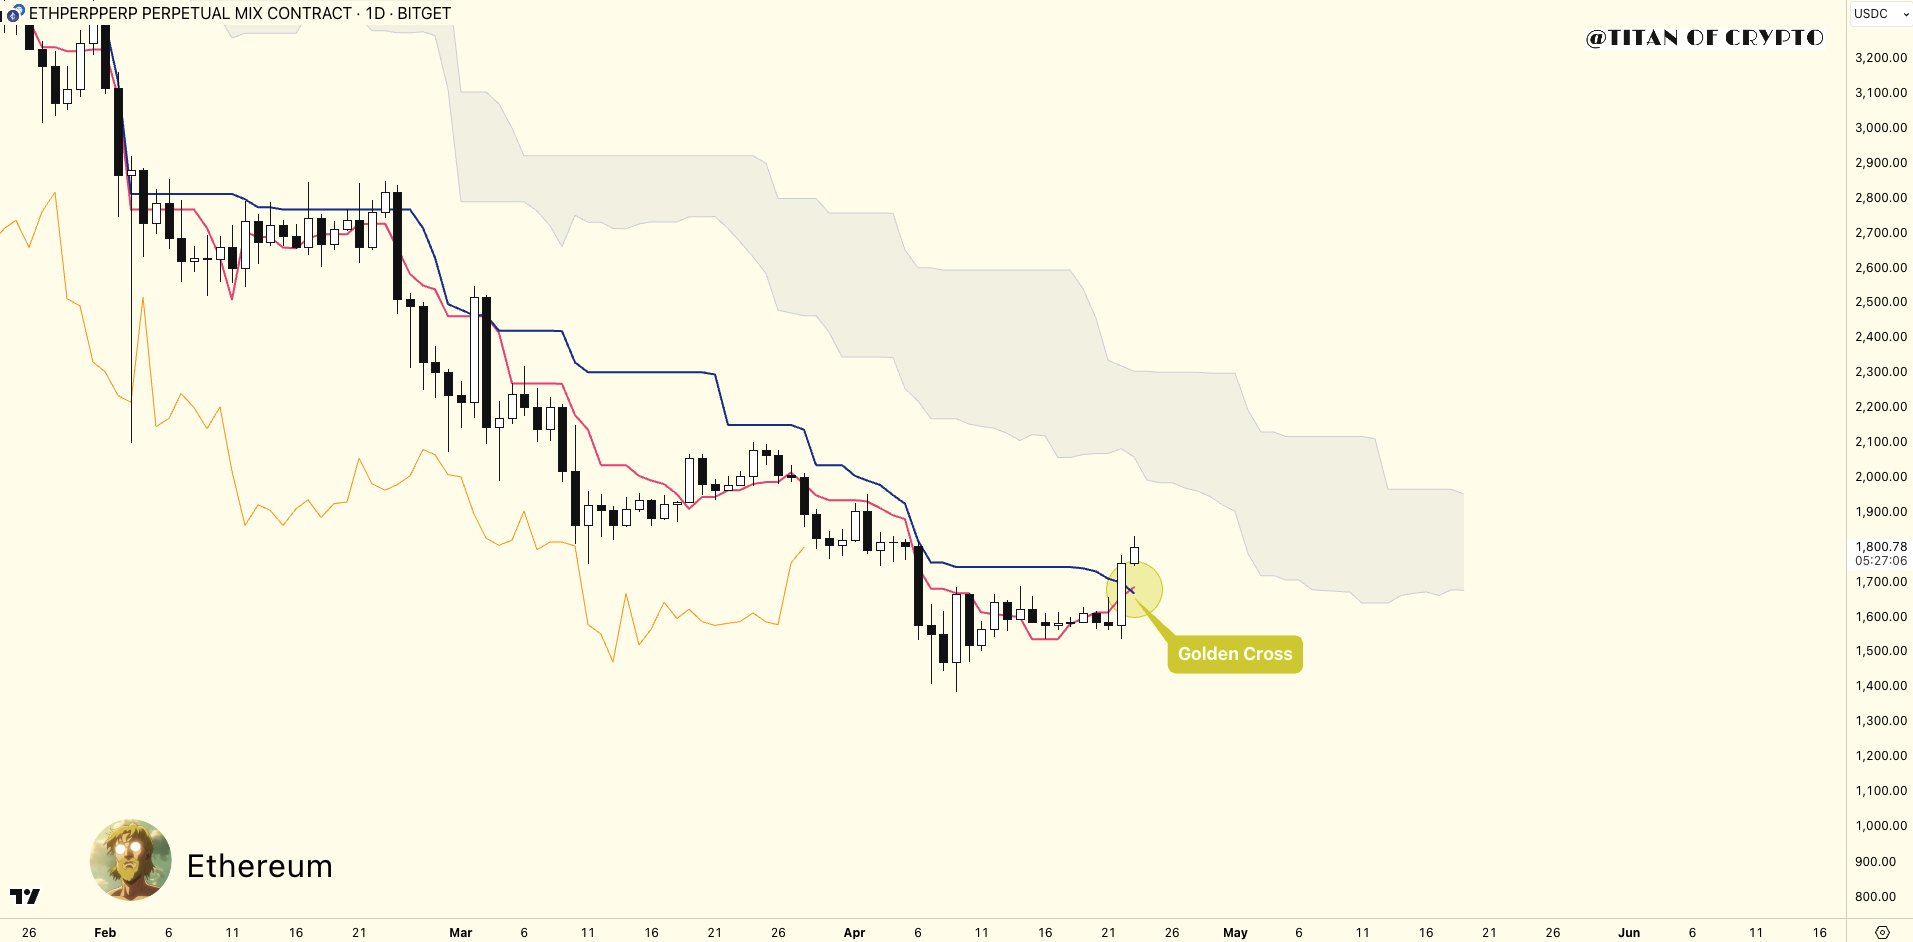
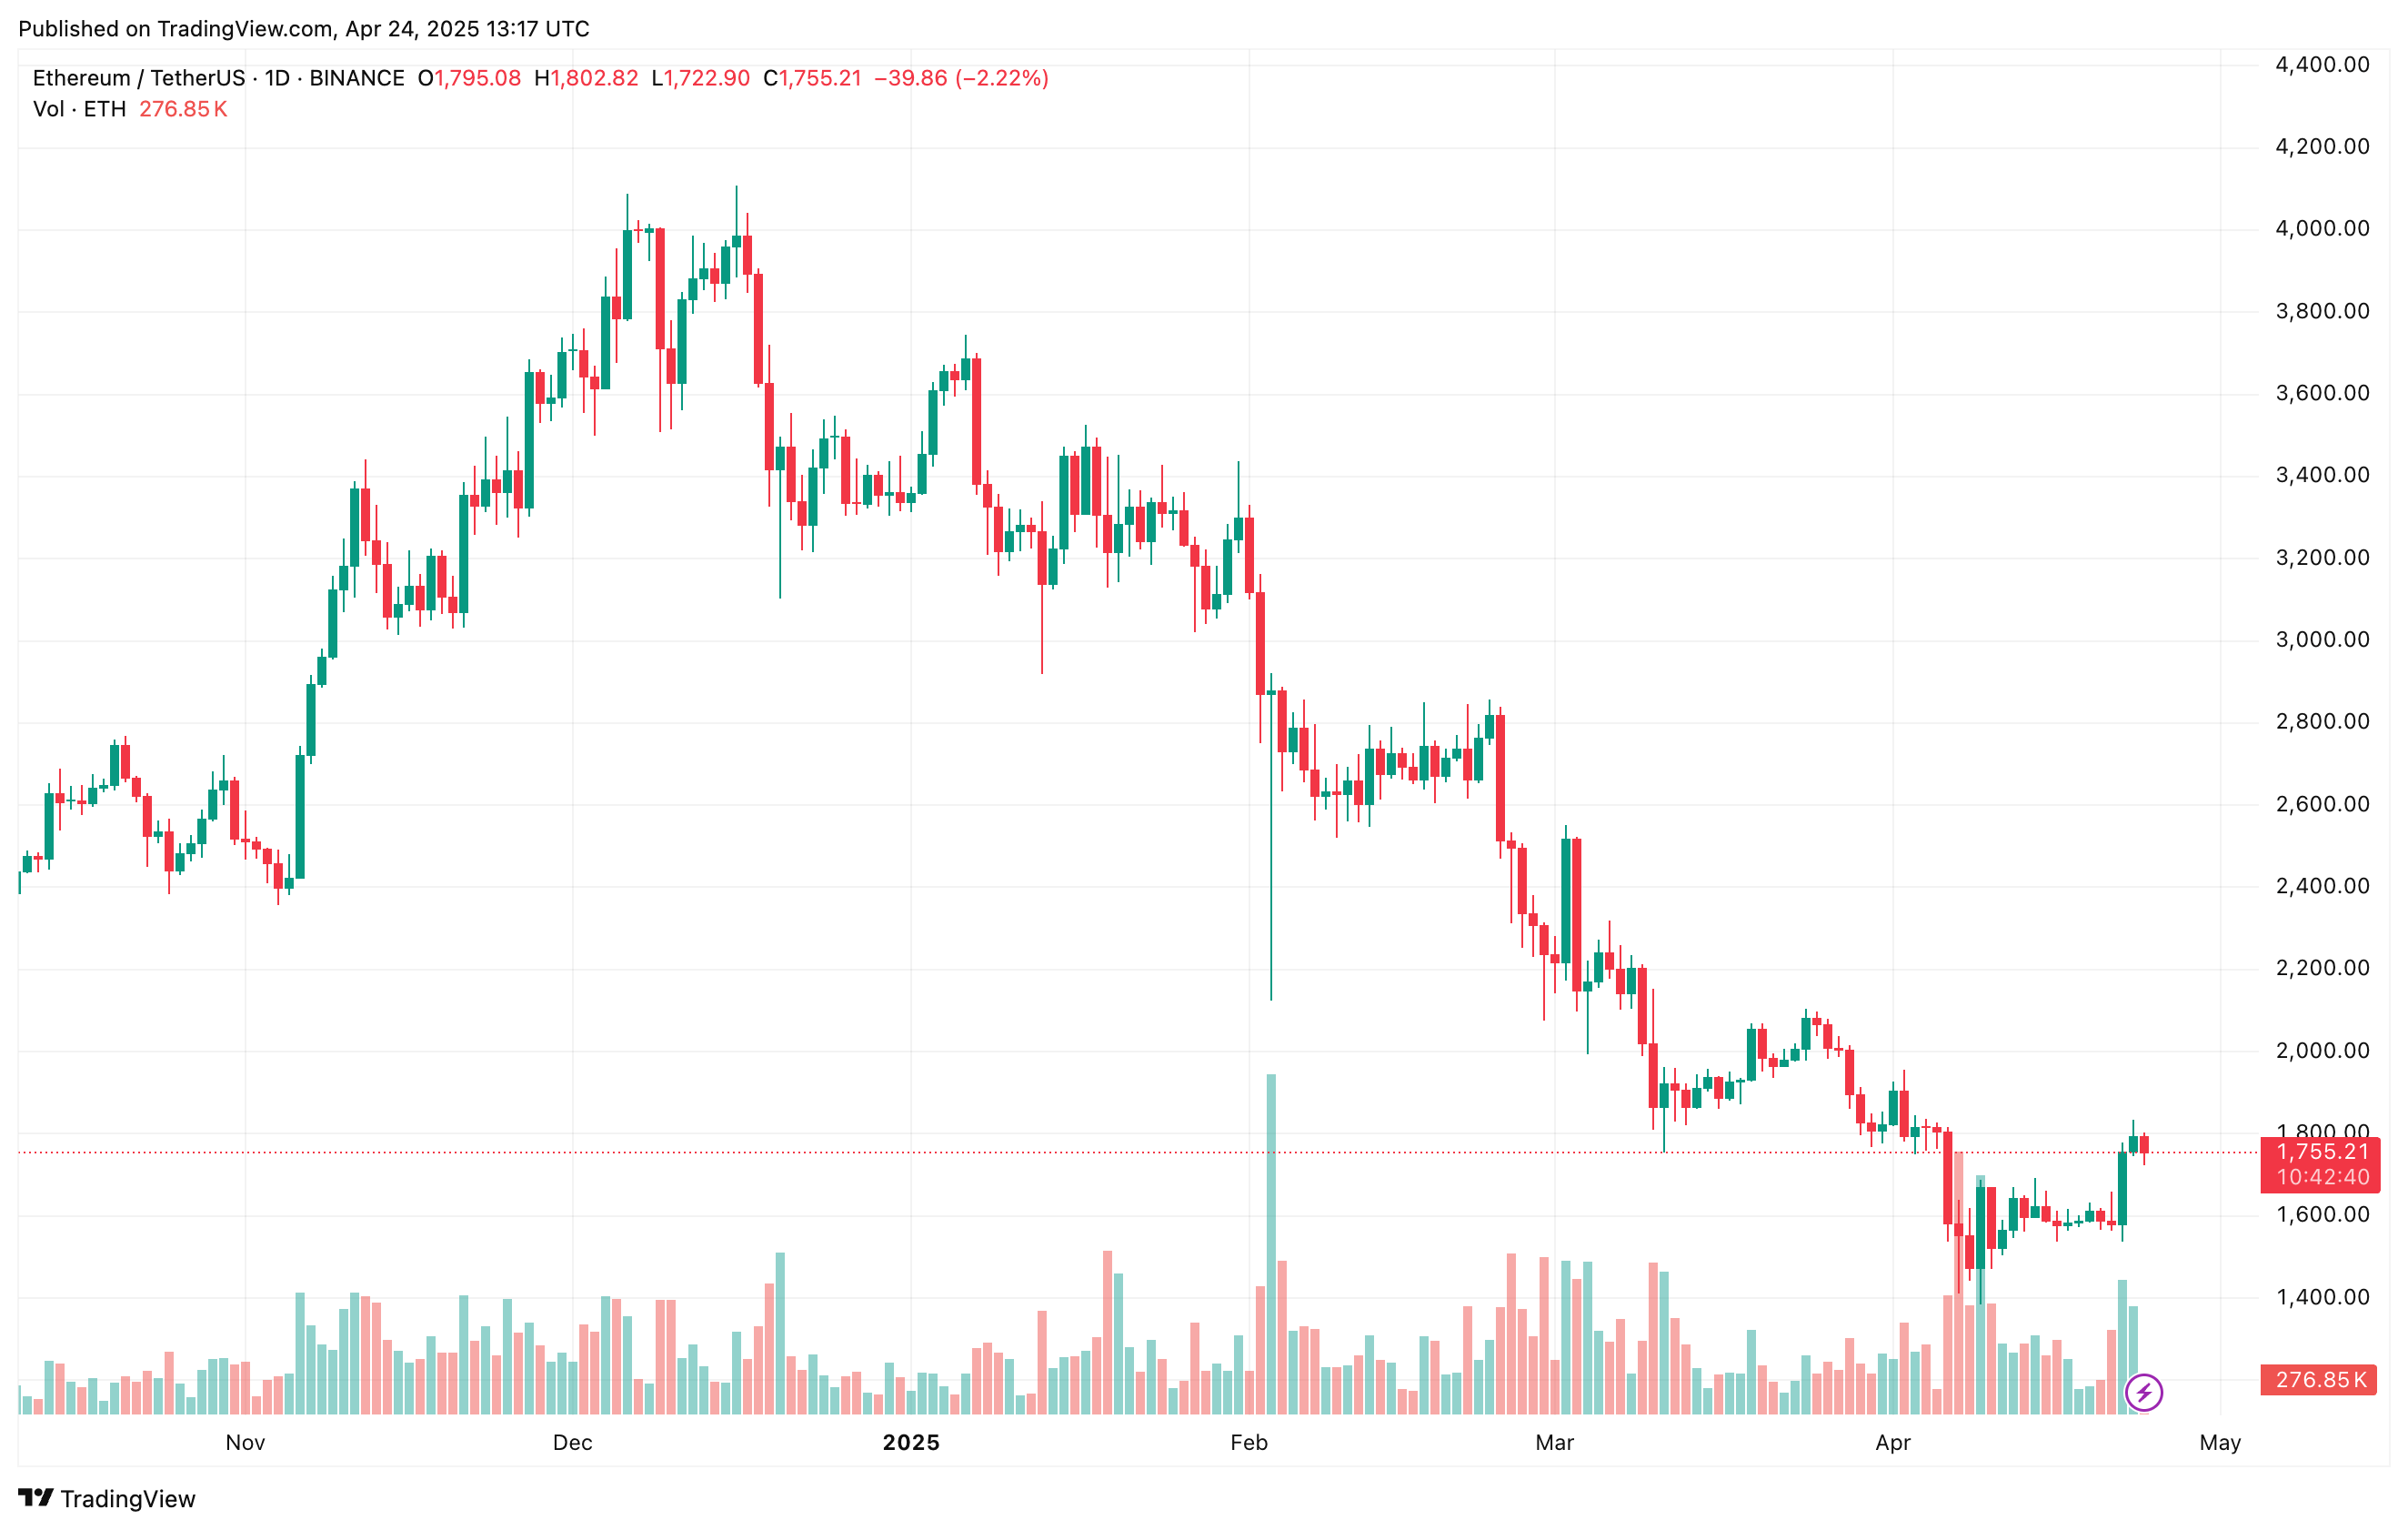
According to a recent X post by crypto analyst Titan of Crypto, Ethereum has formed a golden cross on the daily chart. A golden cross typically precedes significant price rallies, and the continuation of this bullish price action could push ETH beyond $2,000 soon.
For the uninitiated, a golden cross is a technical indicator that flashes when the 50-day moving average (MA) crosses the 200-day moving average (MA). The indicator often suggests a shift from a downtrend to an uptrend in the underlying asset’s price.
The following chart shows the golden cross, with the upward-sloping red line (50-day MA) overtaking the downward-sloping blue line (200-day MA). If this trend holds, it could set the stage for further gains, with the $2,000 mark acting as the next psychological resistance level.
Other analysts also support Titan of Crypto’s bullish outlook for ETH. For example, fellow analyst JJcycles shared a weekly chart illustrating striking similarities between ETH’s current structure and that of Bitcoin (BTC) during past cycles.
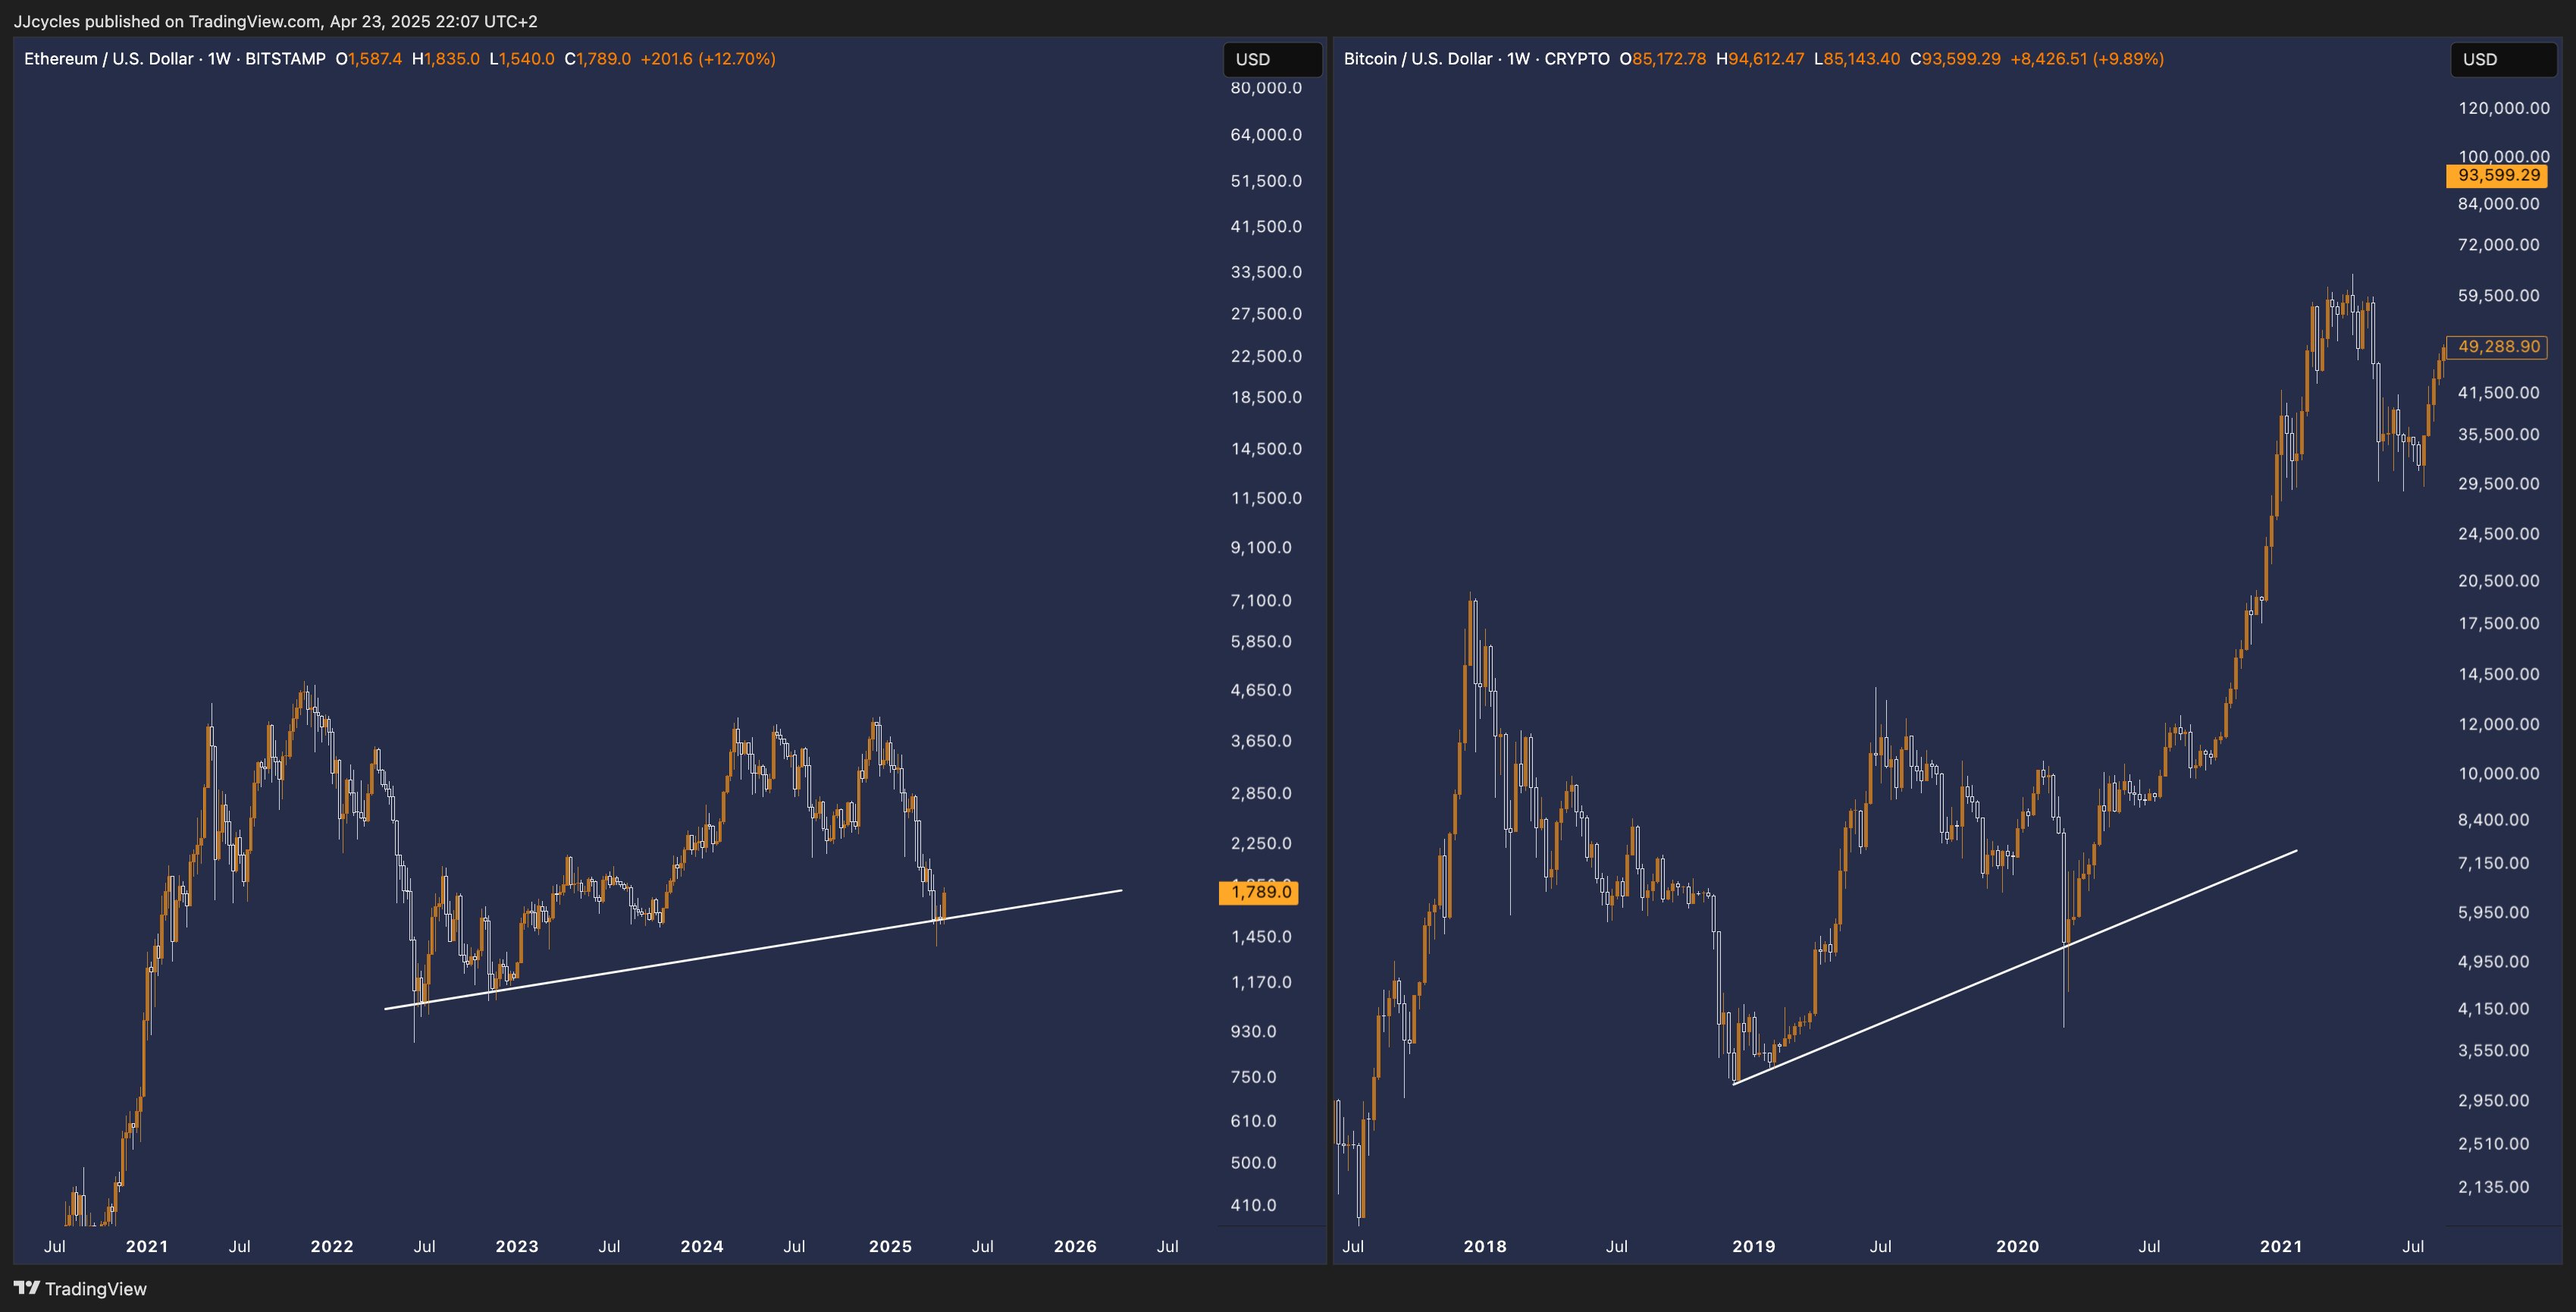
JJcycles noted that ETH may currently be trading NEAR the bottom of the range – close to the support trendline – similar to BTC’s price action around $5,000 following the March 2020 COVID-19 crash.
Potential ETH Targets?
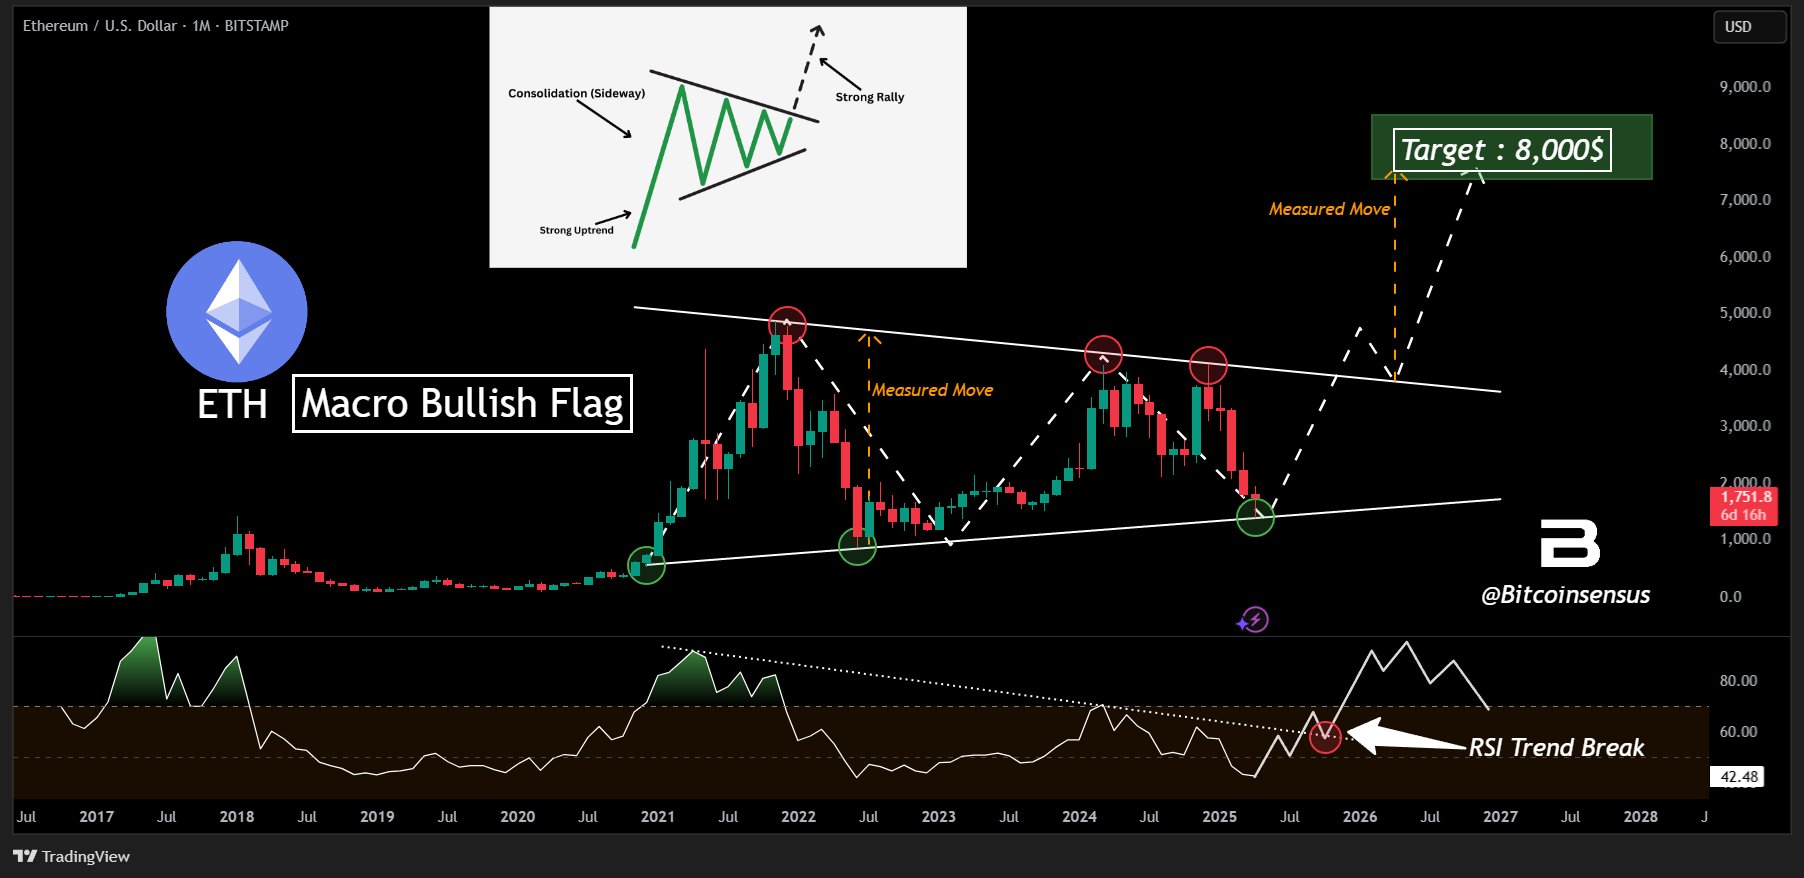
In another X post, crypto trading account Bitcoinsensus pointed out that Ethereum is forming a large bull flag pattern on the monthly chart. The account noted that ETH is currently near the lower boundary of the flag, with a potential breakout target of up to $8,000.
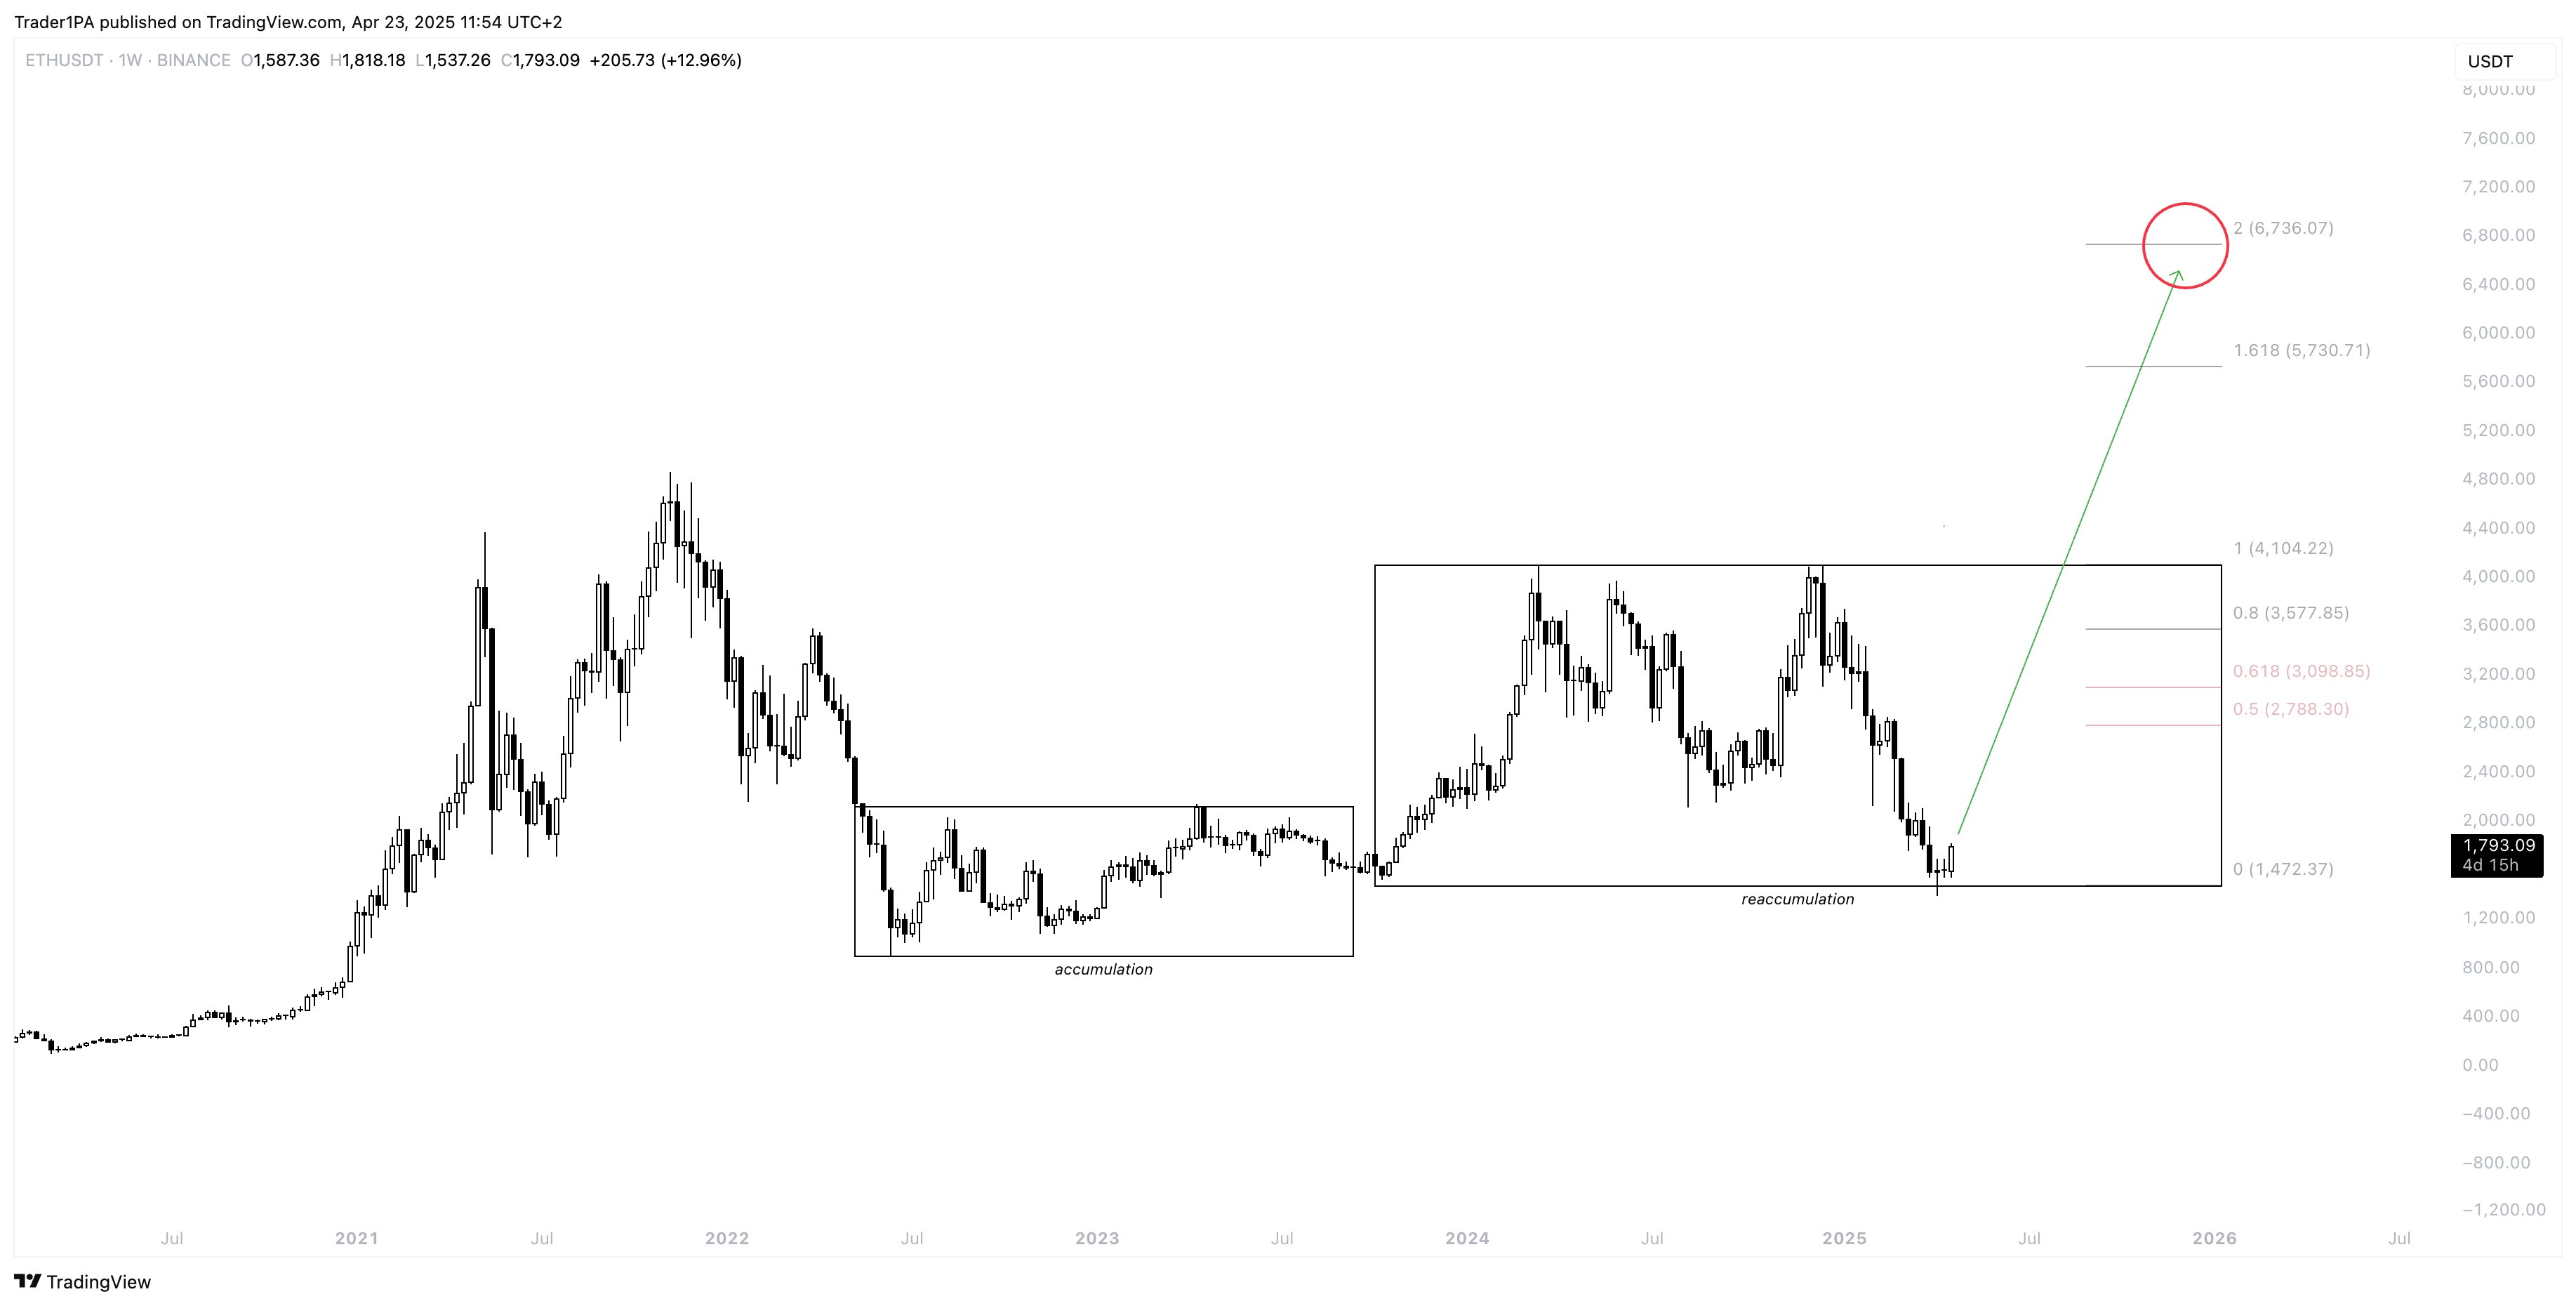
Likewise, seasoned analyst TraderPA suggested ETH is in a reaccumulation phase and could be poised for a strong rally. According to TraderPA, ETH may surge to $6,000 before the year ends.
On-chain metrics also support the case for a bullish reversal. Crypto analyst Ali Martinez recently noted that Ethereum’s Entity-Adjusted Dormancy Flow has dropped below one million – a level that often indicates the asset is undervalued.
Despite the positive indicators, concerns about further downside remain. Ethereum’s weak performance in recent months, coupled with repeated breakdowns through key support levels, raises the risk of a drop to $1,200.
Nonetheless, ETH is projected to see significant price appreciation in Q2 2025, with some analysts forecasting a new all-time high by year’s end. At press time, ETH trades at $1,755, down 3.3% in the last 24 hours.

Log in to Reply
Log in to comment your thoughtsComments
Related Articles
|Square
Get the BTCC app to start your crypto journey
Get started today Scan to join our 100M+ users