BNB Price Correction Creates Prime Buying Opportunity - Here’s Why The Pullback Won’t Last

BNB's temporary retreat after hitting recent highs signals healthy market consolidation rather than bearish momentum.
Market Mechanics At Play
Every major cryptocurrency experiences natural profit-taking phases after strong rallies. BNB's current pullback represents standard market behavior as short-term traders cash out gains while long-term holders accumulate positions.
Fundamental Strength Remains Intact
The Binance ecosystem continues expanding with new project launches and growing adoption metrics. Network activity and transaction volumes maintain robust levels despite price fluctuations.
Technical Support Levels Holding
Key support zones are demonstrating strong buying interest, suggesting institutional and retail investors view current levels as attractive entry points. The underlying blockchain infrastructure keeps improving while competitors struggle with scalability issues.
Market sentiment often overreacts to minor corrections—smart money knows that temporary dips in fundamentally strong assets create the best accumulation windows. The so-called 'downside risks' mostly concern traders who forgot that crypto markets don't move in straight lines.
BNB Price Dips Below Support
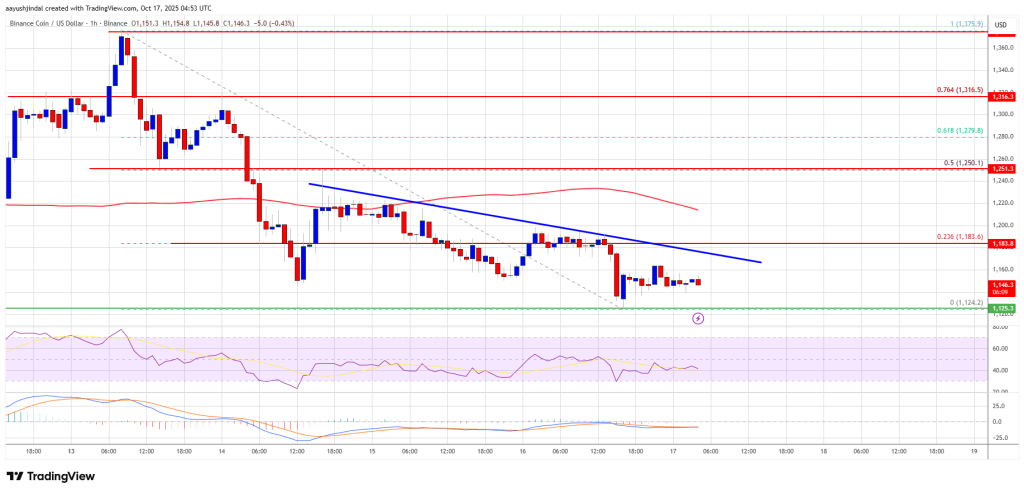
After a steady increase, BNB price failed to clear the $1,375 zone. There was a downside correction below the $1,300 and $1,250 levels, like Ethereum and Bitcoin.
The price even dipped below $1,200 and tested $1,125. A low was formed at $1,124, and the price is now consolidating losses below the 23.6% Fib retracement level of the downward MOVE from the $1,375 swing high to the $1,124 low.
The price is now trading below $1,180 and the 100-hourly simple moving average. Besides, there is a short-term bearish trend line forming with resistance at $1,180 on the hourly chart of the BNB/USD pair.
On the upside, the price could face resistance near the $1,180 level. The next resistance sits near the $1,200 level. A clear move above the $1,200 zone could send the price higher. In the stated case, BNB price could test $1,250 and the 50% Fib retracement level of the downward move from the $1,375 swing high to the $1,124 low.
A close above the $1,250 resistance might set the pace for a larger move toward the $1,320 resistance. Any more gains might call for a test of the $1,350 level in the near term.
Another Decline?
If BNB fails to clear the $1,200 resistance, it could start another decline. Initial support on the downside is near the $1,125 level. The next major support is near the $1,100 level.
The main support sits at $1,065. If there is a downside break below the $1,065 support, the price could drop toward the $1,000 support. Any more losses could initiate a larger decline toward the $950 level.
Technical Indicators
Hourly MACD – The MACD for BNB/USD is gaining pace in the bearish zone.
Hourly RSI (Relative Strength Index) – The RSI for BNB/USD is currently below the 50 level.
Major Support Levels – $1,120 and $1,100.
Major Resistance Levels – $1,200 and $1,250.
