Solana (SOL) Recovery Stalls - Lack of Momentum Threatens Bullish Breakout Potential

Solana's attempted comeback hits a wall as momentum fades
Technical Analysis Breakdown
The SOL chart shows recovery patterns forming but struggling to gain traction. Every upward move gets met with immediate resistance—traders are watching key support levels like hawks. Volume indicators tell the real story: nobody's committing to this rally.
Market Psychology at Play
Investors remember SOL's previous highs and keep waiting for that magic catalyst. Meanwhile, the broader crypto market's indecision isn't helping—when Bitcoin can't decide which way to go, altcoins typically just drift. Classic case of hope outpacing actual buying pressure.
Regulatory Headwinds Persist
Despite recent positive developments in the ETF space, regulatory uncertainty continues to cast a shadow over the entire sector. Because nothing says 'stable investment environment' like constantly changing rules from multiple government agencies.
The breakout potential exists but needs genuine momentum to materialize. Until then, SOL remains stuck in that frustrating space between technical promise and actual price action—the cryptocurrency equivalent of a sports car stuck in traffic.
Solana Price Eyes Recovery
Solana price extended losses below $200 before the bulls took a stand, like Bitcoin and Ethereum. SOL tested the $192 zone and recently started a recovery wave.
The price was able to surpass the $200 and $202 resistance levels. There was a MOVE above the 23.6% Fib retracement level of the downward move from the $242 swing high to the $191 low. Besides, there is a connecting bullish trend line forming with support at $204 on the hourly chart of the SOL/USD pair.
However, the price faces many hurdles near $215. solana is now trading above $205 and the 100-hourly simple moving average. If there are more gains, the price could face resistance near the $215 level. The next major resistance is near the $216 level or the 50% Fib retracement level of the downward move from the $242 swing high to the $191 low. The main resistance could be $220.
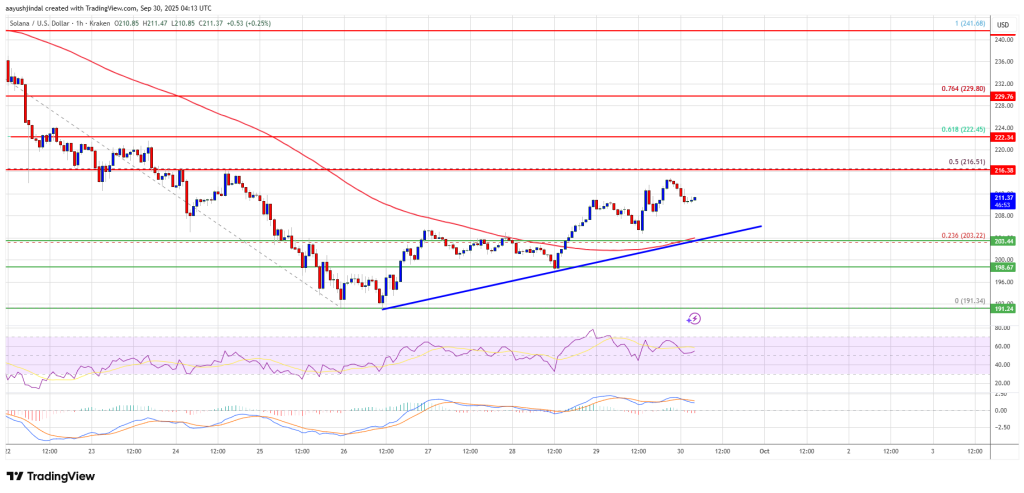
A successful close above the $220 resistance zone could set the pace for another steady increase. The next key resistance is $230. Any more gains might send the price toward the $242 level.
Another Drop In SOL?
If SOL fails to rise above the $216 resistance, it could continue to move down. Initial support on the downside is NEAR the $204 zone and the trend line. The first major support is near the $202 level.
A break below the $202 level might send the price toward the $200 support zone. If there is a close below the $200 support, the price could decline toward the $192 support in the near term.
Technical Indicators
Hourly MACD – The MACD for SOL/USD is losing pace in the bullish zone.
Hourly Hours RSI (Relative Strength Index) – The RSI for SOL/USD is above the 50 level.
Major Support Levels – $204 and $200.
Major Resistance Levels – $216 and $220.
