Bitcoin Shatters Resistance Walls - Bulls Charge Toward Next Critical Level

Bitcoin just blasted through key resistance levels - but the real test lies ahead.
The Rally That Refuses to Die
BTC's latest surge demonstrates the market's relentless appetite for digital gold. After weeks of consolidation, the breakout confirms what crypto veterans already knew: institutional money keeps flowing in despite regulatory headwinds.
Next Stop: The Big One
All eyes now focus on the next resistance barrier. Technical analysts warn this level could trigger significant profit-taking - because nothing makes traders happier than cashing out before the next dip.
Meanwhile, traditional finance executives continue dismissing Bitcoin as a 'speculative asset' while quietly allocating 2% of their portfolios to it. The ultimate hedge against their own incompetence.
Bitcoin Price Gains Traction
Bitcoin price managed to stay above the $110,500 zone and started a recovery wave. BTC settled above the $112,500 resistance zone to start the current move.
The bulls were able to pump the price above the $113,500 and $114,000 levels. Besides, there was a break above a key bearish trend line with resistance at $112,200 on the hourly chart of the BTC/USD pair. The bulls even cleared the $114,000 level.
A high was formed at $114,771 and the price is now consolidating gains above the 23.6% Fib retracement level of the upward move from the $108,677 swing low to the $114,771 high. Bitcoin is now trading above $114,000 and the 100 hourly Simple moving average.
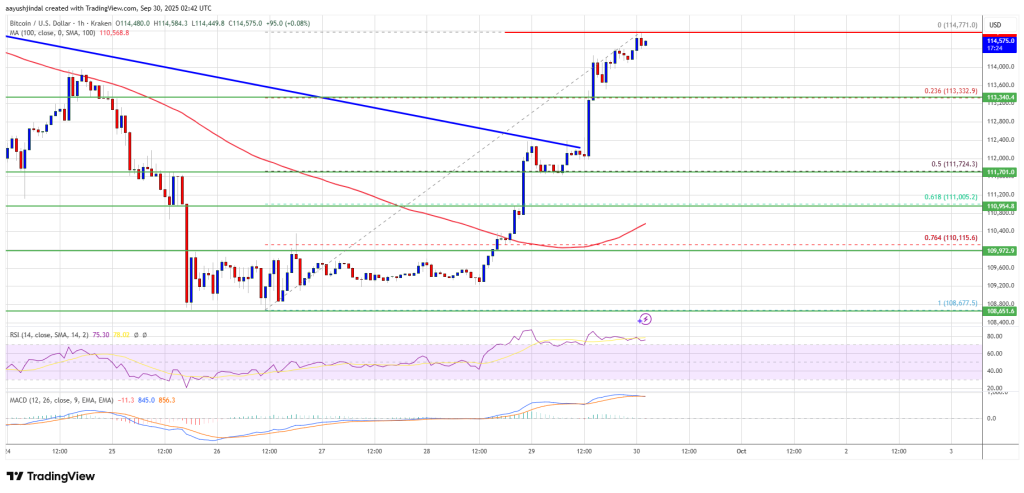
Immediate resistance on the upside is near the $114,750 level. The first key resistance is near the $115,000 level. The next resistance could be $115,500. A close above the $115,500 resistance might send the price further higher. In the stated case, the price could rise and test the $116,500 resistance. Any more gains might send the price toward the $117,500 level. The next barrier for the bulls could be $118,00.
Another Drop In BTC?
If bitcoin fails to rise above the $115,000 resistance zone, it could start a fresh decline. Immediate support is near the $113,500 level. The first major support is near the $112,500 level.
The next support is now near the $111,750 zone. Any more losses might send the price toward the $111,200 support in the near term. The main support sits at $110,500, below which BTC might struggle to recover in the short term.
Technical indicators:
Hourly MACD – The MACD is now gaining pace in the bullish zone.
Hourly RSI (Relative Strength Index) – The RSI for BTC/USD is now above the 50 level.
Major Support Levels – $113,500, followed by $112,500.
Major Resistance Levels – $114,750 and $115,000.
