Bitcoin’s Daily RSI Hits Most Oversold Level Since April — Is This The Ultimate Buying Opportunity?

Bitcoin's technical indicator flashes extreme oversold signal not seen in months.
RSI Plunge Signals Potential Rebound
The Relative Strength Index just hit its lowest reading since April, suggesting Bitcoin might be primed for a significant bounce. Traders are watching this key momentum indicator like hawks circling prey.
Historical Patterns Don't Lie
Previous instances of such extreme RSI levels have often preceded substantial price recoveries. The current setup mirrors conditions that historically marked attractive entry points for savvy investors.
Market Psychology at Breaking Point
When fear dominates and technical indicators scream oversold, contrarian strategies often pay off. This could be one of those moments where going against the herd proves profitable—or just another trap set by market makers who still think technical analysis works like it's 1987.
Timing the crypto markets requires equal parts data and guts. The RSI says buy—but will the market listen?
Has The Bitcoin Price Reached A Bottom?
In a September 26 post on the X platform, a crypto analyst named after the renowned economist Frank Fetter revealed that the price of Bitcoin might have just entered a buy zone. This price projection is based on the relative strength index (RSI) indicator on the daily BTC price chart.
The relative strength index is a momentum indicator used in technical price analysis to assess the magnitude and speed at which an asset’s price changes. The RSI oscillator is usually used to analyze whether a crypto asset (Bitcoin, in this case) is being overbought or oversold, suggesting a possible price or trend reversal.
When the relative strength index breaks above 70, it typically indicates an overbought market condition, with the asset’s price likely to face selling pressure. Meanwhile, an RSI value below 30 implies that the market is in an oversold condition, with price on the verge of a potential rebound.
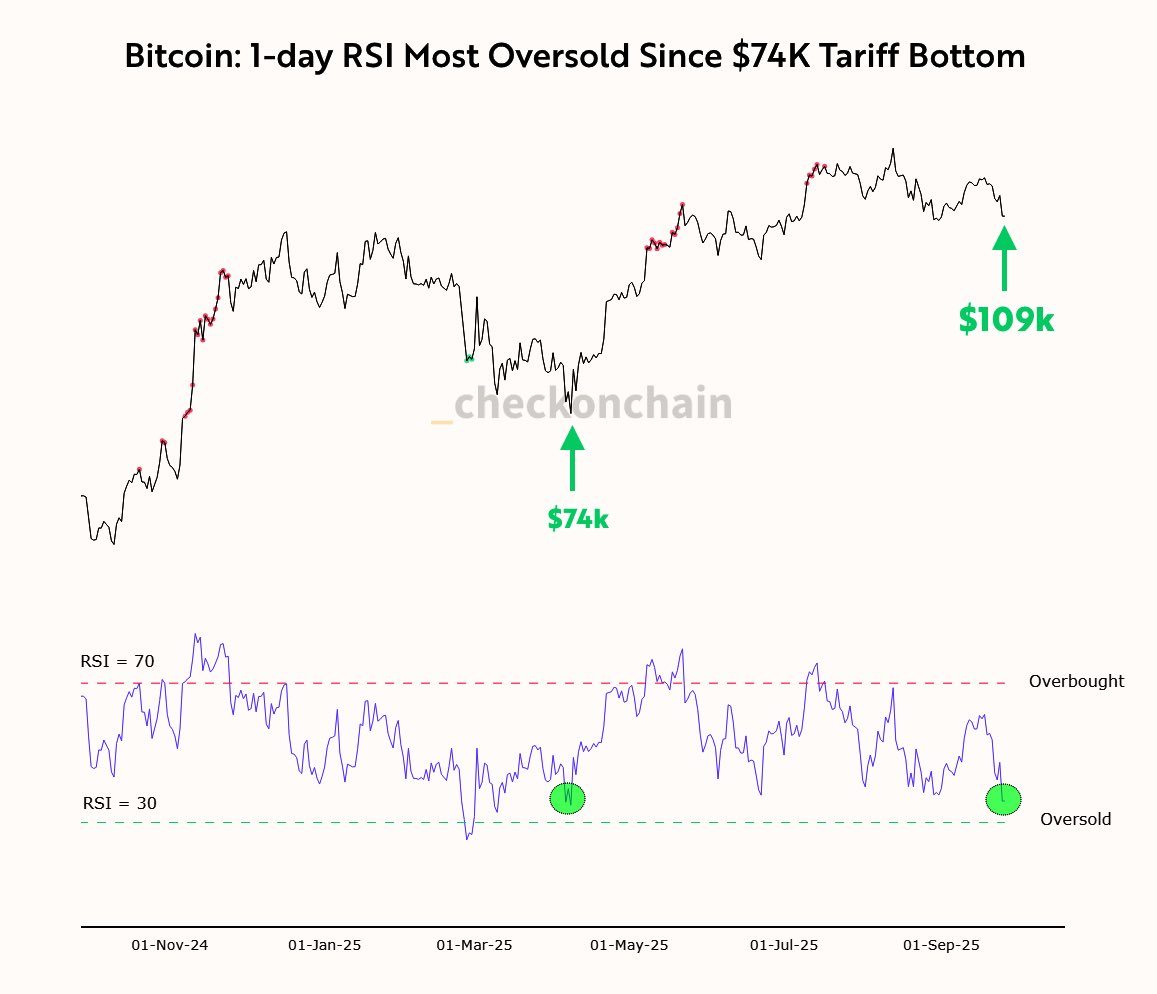
According to Fetter, the Bitcoin relative strength index on the daily chart has fallen to its lowest level since the April price bottom of $74,000. This price downturn, which was triggered by the tariff war between the United States and China, saw the RSI oscillator fall beneath the 30 threshold in March.
Since bottoming out at the $74,000 mark and the RSI low in April, the Bitcoin price has since gone on to set multiple all-time highs. If history is anything to go by, there is a chance that the flagship cryptocurrency could find support at its current price and run up to a new high.
As of this writing, BTC is valued at around $109,331, reflecting a mere 0.2% jump in the past 24 hours. According to data from CoinGecko, the premier cryptocurrency is down by more than 5% on the weekly timeframe.
Crypto Market Enters ‘Fear’ Zone
The crypto Fear & Greed Index is another signal suggesting a buy opportunity in the bitcoin market at the moment. According to the latest on-chain data from Alphractal, this metric has dropped to 28, signaling strong fear amongst digital asset investors.
Meanwhile, the Fear & Greed Index of the stock market is at a neutral level, meaning that pessimism has yet to hit the traditional markets. With the crypto Fear & Greed Index at its lowest level since April 2025, the divergence from the traditional markets suggests potential accumulation opportunities in the digital asset market.
