Bitcoin at a Crossroads: Will BTC Surge to $130K or Retreat to $113K? Technical Analysis & Market Sentiment

- What Do the Technical Indicators Reveal About BTC's Next Move?
- How Are Institutional Investors Positioning Themselves?
- MicroStrategy's Bitcoin Bet: Genius or Gambler's Folly?
- What Warning Signals Are Flashing in the Derivatives Market?
- Is Altseason Imminent as Bitcoin Tests $120K?
- What Are the Key Price Scenarios for Bitcoin?
- Frequently Asked Questions
As Bitcoin hovers around $118,000, traders face a critical juncture. The cryptocurrency shows bullish technical signals while facing resistance at all-time highs, creating a fascinating tension between institutional accumulation and potential profit-taking. This analysis examines the key factors that could determine whether BTC breaks out to $130K or retests support at $113K.
What Do the Technical Indicators Reveal About BTC's Next Move?
According to TradingView data, bitcoin currently trades at $118,029.80, comfortably above its 20-day moving average of $113,323.72. The MACD indicator, while still in negative territory, shows signs of convergence—a classic signal that bearish momentum may be waning. Meanwhile, the price tests the upper Bollinger Band at $123,267.88, suggesting heightened volatility ahead.
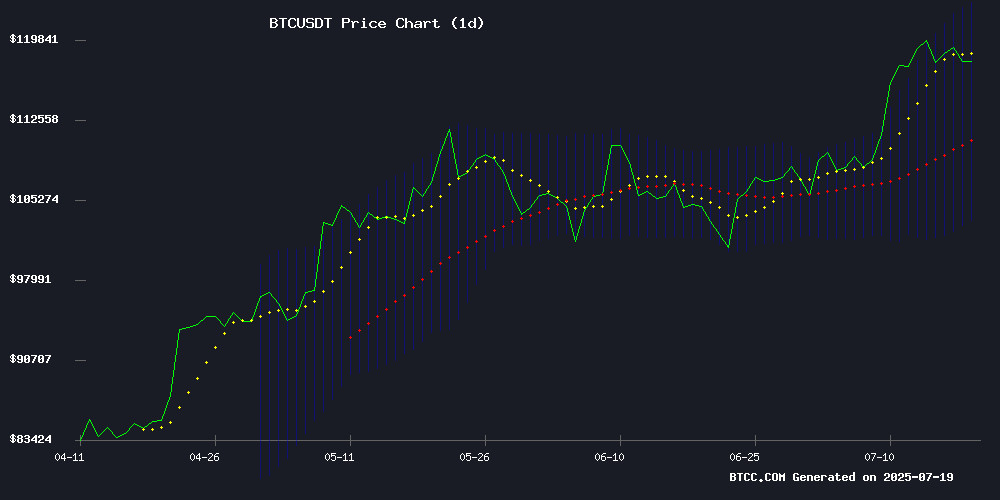
Source: BTCC Trading Platform
How Are Institutional Investors Positioning Themselves?
The institutional landscape presents mixed signals. On one hand, corporate treasury additions continue unabated—public companies now safeguard approximately $72 billion in BTC holdings. Hedge funds employing Bitcoin strategies have achieved staggering 640% returns, with 210k Capital's innovative proxy approach standing out.
However, on-chain data reveals long-term holders (retaining BTC for 155+ days) have begun distributing assets, while short-term traders accumulate aggressively. This divergence mirrors patterns seen before previous market pullbacks in April 2021 and November 2023.
MicroStrategy's Bitcoin Bet: Genius or Gambler's Folly?
Michael Saylor's unwavering Bitcoin maximalism continues making headlines. MicroStrategy's MSTR shares have skyrocketed 3,588% during what analysts call the "Bitcoin Standard era," dramatically outpacing BTC's 905% gain. The company now holds 214,400 BTC worth approximately $15 billion—transforming the enterprise software firm into a de facto Bitcoin ETF.
"The only thing better than Bitcoin is more Bitcoin," Saylor recently declared on social media. While critics question the concentration risk, the performance speaks for itself—at least so far.
What Warning Signals Are Flashing in the Derivatives Market?
Several metrics suggest caution:
- The 90-day Spent Output Profit Ratio (SOPR) approaches 1.018, nearing the 1.02 threshold that historically precedes 10-20% corrections
- Network Value to Transactions (NVT) and Network Value to Metcalfe (NVM) ratios declined 11.21% and 16.21% respectively
- Exchange inflows show whales moving 1,000-10,000 BTC batches to trading platforms
Yet perpetual swap funding rates remain moderate, and exchange reserves continue declining—signs that Leveraged longs haven't reached extreme levels yet.
Is Altseason Imminent as Bitcoin Tests $120K?
Three metrics suggest capital may rotate into altcoins:
- The Altcoin Index surged 300% to 50 from 15 in under a month
- Bitcoin dominance retreated below 58% from recent 62% highs
- Historical patterns show extended BTC rallies often precede altcoin runs
However, the BTCC research team notes these transitions typically occur in waves rather than abrupt switches. Traders should watch for confirmation signals.
What Are the Key Price Scenarios for Bitcoin?
| Scenario | Trigger | Price Target | Timeframe |
|---|---|---|---|
| Bullish | Daily close above $123K | $130K-$135K | 2-3 weeks |
| Neutral | Hold $113K support | $118K-$123K | Consolidation |
| Bearish | SOPR correction | 20% pullback ($94K) | Risk if $113K breaks |
Frequently Asked Questions
What's the most important technical level to watch for Bitcoin?
The $123,000 resistance level represents Bitcoin's all-time high. A decisive break above this level could trigger momentum buying toward $130K, while rejection here might lead to a retest of support at $113K.
How reliable are the altseason indicators?
While the Altcoin Index and Bitcoin dominance metrics show promising signs, altseason transitions typically develop over weeks rather than days. The BTCC team recommends watching for sustained capital flows into altcoins before confirming the trend.
What's driving institutional Bitcoin adoption?
Three primary factors: 1) Inflation hedging amid global monetary expansion, 2) Demonstrated outperformance versus traditional assets, and 3) Growing regulatory clarity in major markets like the U.S. and Europe.
Should traders be concerned about the SOPR indicator?
While the approaching 1.02 SOPR level warrants caution, it's not a guaranteed sell signal. The metric reflects profit-taking pressure that could be absorbed by institutional demand. Traders should consider it alongside other indicators.
What's the most surprising development in Bitcoin markets?
The IMF's exposure of El Salvador's false Bitcoin accumulation claims shocked many observers. Despite President Bukele's social media claims of daily purchases, the country halted acquisitions after its December 2024 bailout—a stark reminder to verify all crypto-related claims.
