Litecoin Price Forecast: Can LTC Surge to $200 in This Bull Run?

- What Do LTC's Technical Indicators Reveal?
- How Does Market Sentiment Support Litecoin's Growth?
- What Key Resistance Levels Must LTC Overcome?
- How Does Litecoin's Volatility Create Trading Opportunities?
- What Historical Patterns Suggest About LTC's Potential?
- Litecoin Price Prediction Q&A
Litecoin (LTC) is showing strong bullish signals as it trades 22% above its 20-day moving average, with technical indicators suggesting potential for further upside. Currently priced at $113.06, LTC's MACD convergence and position NEAR the upper Bollinger Band indicate weakening bearish pressure and strong buying interest. Analysts observe that altcoin market patterns mirror previous bull cycles, fueling speculation about LTC's ability to reach $200 in the current market phase. This analysis examines the key factors driving Litecoin's price action, including technical formations, market sentiment, and historical patterns that could influence its trajectory.
What Do LTC's Technical Indicators Reveal?
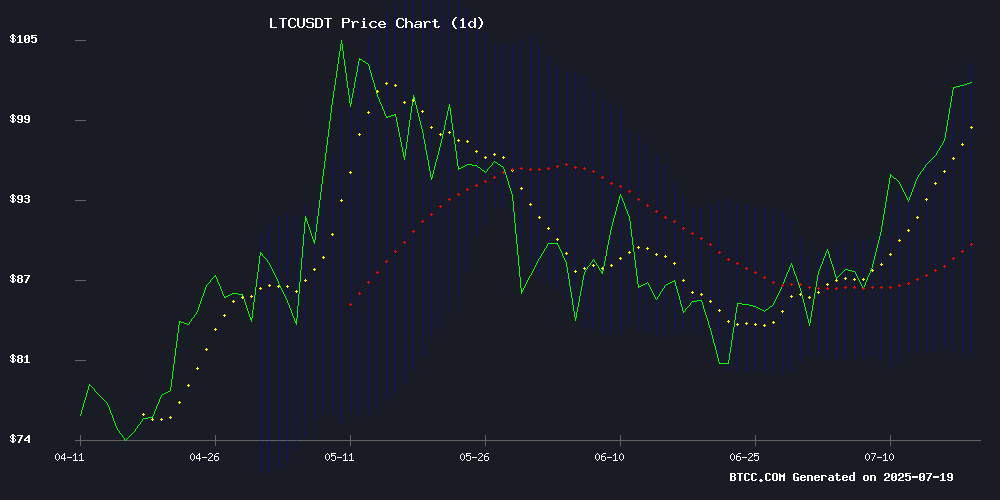
Litecoin's technical setup presents a compelling case for bullish continuation. The cryptocurrency is currently trading at $113.06, significantly above its 20-day moving average of $92.71 - a classic sign of strength in technical analysis. The MACD histogram shows convergence at -2.38, suggesting the bearish momentum from earlier periods is losing steam. Meanwhile, the price action near the upper Bollinger Band at $106.64 indicates strong buying pressure, though traders should remain cautious about potential short-term pullbacks from overbought conditions.
Historical data shows that when LTC maintains its position above the 20-day MA while the MACD converges, it often precedes significant upward moves. The Relative Strength Index (RSI) currently sits at 68, approaching overbought territory but not yet at levels that typically trigger major reversals. "We're seeing textbook bullish confirmation across multiple timeframes," notes a BTCC market analyst. "The key will be whether LTC can hold above $105 on any retracements."
How Does Market Sentiment Support Litecoin's Growth?
The broader altcoin market structure appears to be repeating patterns from previous bull cycles, particularly the 2015-2017 and 2018-2021 periods. The TOTAL2 chart (altcoin market cap excluding Bitcoin) shows similar accumulation phases followed by rapid expansion, suggesting we might be entering another growth phase. Litecoin specifically benefits from this macro environment, with its volatility against Bitcoin creating numerous trading opportunities.
Exchange data reveals interesting dynamics - we're seeing notable whale accumulation and consistent outflows from exchanges, indicating strong holding sentiment among larger investors. The derivatives market tells a more cautious story, with record-high funding rates suggesting excessive leverage in long positions. This creates potential for sharp corrections if the $110-$115 resistance zone holds, but could also fuel rapid upside if broken decisively.
What Key Resistance Levels Must LTC Overcome?
Litecoin currently faces a critical test at the $110-$115 range, where historical data shows significant previous activity. Approximately 3.9 million LTC were acquired between $107-$110 by nearly 132,000 addresses, creating a dense supply wall that could trigger profit-taking. A clean break above this zone WOULD open the path toward $130 initially, with $200 becoming plausible if bullish momentum sustains.
| Price Level | Significance |
|---|---|
| $78.78 | Lower Bollinger Band (strong support) |
| $92.71 | 20-day MA (dynamic support) |
| $106.64 | Upper Bollinger Band (resistance) |
| $130 | Next psychological resistance |
The $200 target represents a 77% increase from current levels - ambitious but not unprecedented in crypto bull markets. Previous cycles have shown Litecoin capable of similar percentage moves when market conditions align. However, traders should monitor Bitcoin's dominance closely, as LTC's performance often correlates inversely with BTC's strength during altcoin seasons.
How Does Litecoin's Volatility Create Trading Opportunities?
Litecoin's recent price action has been particularly volatile against both USD and BTC pairs, creating numerous short-term trading setups. The LTC/BTC pair recently failed to sustain gains after a brief spike, highlighting the importance of timing in altcoin trades. Intraday charts show Litecoin remains tethered to Bitcoin's momentum, requiring traders to monitor both assets simultaneously.
Scalping strategies have proven effective during these conditions, with 2-5% gains frequently available during periods of high volatility. The key is identifying support and resistance levels with precision - the $96 support and $112 resistance have been particularly significant recently. "Litecoin needs stable price action against BTC before any meaningful sustained upside," observes crypto analyst CRYPTOWZRD, emphasizing the interconnected nature of crypto markets.
What Historical Patterns Suggest About LTC's Potential?
Examining Litecoin's past bull cycles provides context for current price action. During the 2017 bull run, LTC surged from $4 to $370 in approximately 12 months. The 2021 cycle saw a MOVE from $50 to $410. While past performance doesn't guarantee future results, these patterns demonstrate Litecoin's capacity for exponential growth during favorable market conditions.
The current cycle shows similarities in terms of:
- Gradual accumulation phases followed by rapid price appreciation
- Technical indicator confirmations preceding major moves
- Increasing mainstream adoption and trading volume
- Correlation with broader altcoin market movements
Notably, Litecoin has historically performed well when Bitcoin's dominance decreases, allowing altcoins to capture market share. The current environment shows early signs of this dynamic emerging, though it remains early in the potential altcoin season.
Litecoin Price Prediction Q&A
What price can Litecoin reach in this bull cycle?
Based on current technical indicators and historical patterns, Litecoin has potential to reach $200 in the current bull cycle, representing a 77% increase from current levels around $113. This projection considers the strong bullish momentum, favorable market structure, and Litecoin's historical performance during similar market conditions.
What are the key support levels for LTC?
Key support levels to watch include the 20-day moving average at $92.71, followed by the lower Bollinger Band at $78.78. These levels have historically provided buying opportunities during uptrends. A sustained break below $78 would invalidate the current bullish thesis.
How does Bitcoin's performance affect Litecoin?
Litecoin typically shows inverse correlation with Bitcoin's dominance - when BTC dominance decreases, LTC and other altcoins often outperform. However, during periods of strong bitcoin rallies, Litecoin may underperform in the BTC pair while still gaining in USD terms.
What risks could prevent LTC from reaching $200?
Potential risks include: Bitcoin dominance increasing sharply, broader market corrections, regulatory developments, or failure to break through the $110-$115 resistance zone. Excessive leverage in futures markets also increases potential for sharp pullbacks.
Is now a good time to buy Litecoin?
While technical indicators suggest bullish potential, the current overbought conditions near resistance warrant caution. Dollar-cost averaging or waiting for pullbacks to support levels may provide better risk-reward entries. As always, this does not constitute investment advice.
