Dogecoin Price Forecast: DOGE Battles 200-Day EMA as Selling Pressure Mounts

Dogecoin faces a critical technical test as it struggles to hold ground against its 200-day exponential moving average. Selling pressure builds momentum, threatening to push the meme coin below a key support level that traders have been watching for months.
The 200-day EMA isn't just another line on the chart—it's the psychological dividing line between bull and bear territory. When DOGE can't punch through this barrier, it signals that even the most enthusiastic retail investors might be losing their appetite for risk.
Technical indicators suggest the resistance isn't breaking anytime soon. Each attempt to climb above the EMA gets met with increased selling volume—classic distribution patterns that typically precede deeper corrections.
Market sentiment around Dogecoin mirrors the broader altcoin complex's struggle for direction. Without a clear catalyst to spark renewed buying interest, DOGE risks getting stuck in a sideways grind that benefits neither bulls nor bears.
Remember when financial analysts said Dogecoin would never hit a dollar? They're probably feeling pretty smug right now—but in crypto, being right for the wrong reasons is still being right.
Dogecoin’s derivatives and on-chain metrics raise the risk of further downside
CoinGlass’s OI-Weighted Funding Rate data shows that the number of traders betting that the price of Dogecoin will slide further is higher than that anticipating a price increase.
The metric flipped to a negative rate on Tuesday, reading 0.0010%, indicating that shorts are paying longs. Historically, as shown in the chart below, when the funding rates have flipped from positive to negative, DOGE’s price has fallen.
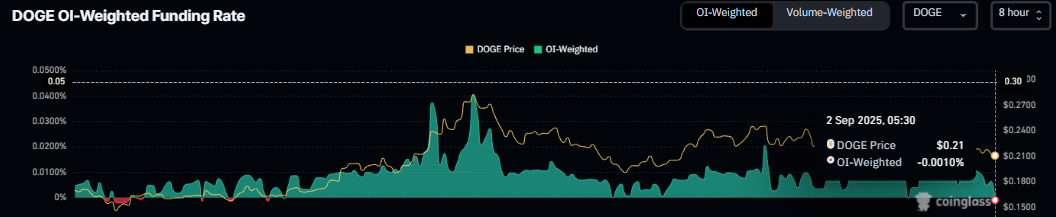
DOGE funding rate chart. Source: Coinglass
Apart from the negative funding rates, the long-to-short ratio for Doge also suggests a bearish sentiment as short bets are rising among the traders.
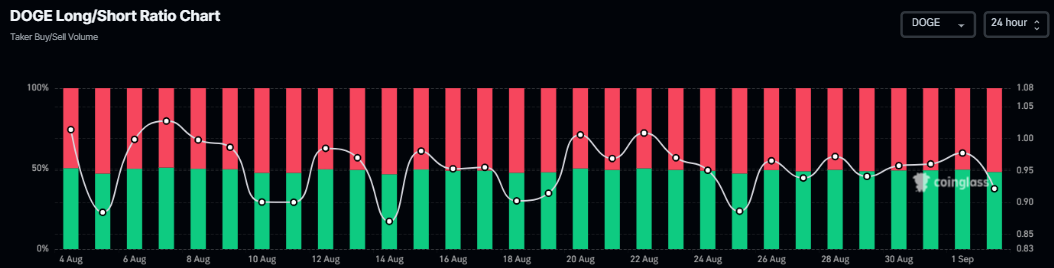
Dogecoin long-to-short ratio chart. Source: Coinglass
Santiment’s Supply Distribution data points to a bearish outlook for the dog-based meme coin, as holders are offloading DOGE tokens.
The metric shows that whales holding between 100,000 and 1 million DOGE tokens (red line), 1 million and 10 million (yellow line), and 10 million and 100 million (blue line) have shed a total of 250 million DOGE tokens since August 25, supporting the bearish view.
%20%5B07-1756783770770-1756783770772.45.52,%2002%20Sep,%202025%5D.png)
Dogecoin supply distribution chart. Source: Santiment
Dogecoin Price Forecast: A close below the 200-day EMA hints at further correction
Dogecoin price found rejection from its previously broken ascending trendline (drawn by connecting multiple lows since June 22) on Sunday and declined by nearly 3% the following day. At the time of writing on Tuesday, it hovers around its 200-day EMA at $0.211.
If DOGE closes below the $0.211 level on a daily basis, it could extend the correction to retest its weekly support at $0.181.
The Relative Strength Index (RSI) on the daily chart reads 46, still trading below its neutral level of 50, suggesting a bearish momentum. The Moving Average Convergence Divergence (MACD) continues to display a bearish crossover, further reinforcing the bearish outlook.
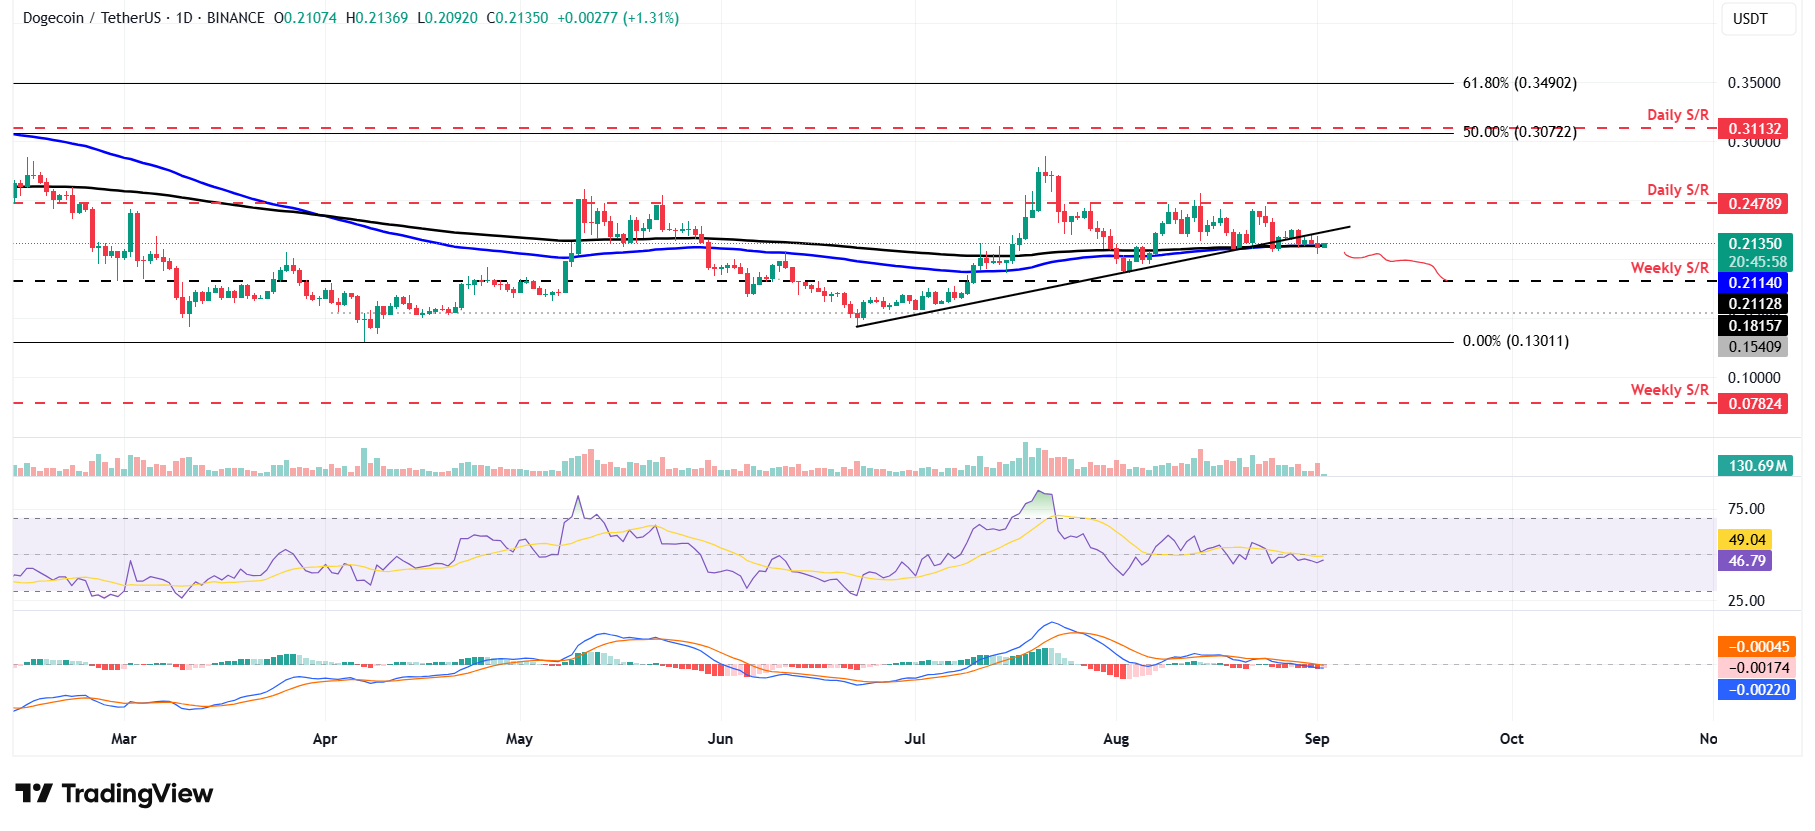
DOGE/USDT daily chart
However, if the 200-day EMA at $0.211 holds as support, DOGE could extend the recovery toward its daily resistance level at $0.247.
