Cardano (ADA) Primed for Rally: $1.44B Open Interest Signals Bullish Breakout Ahead

Cardano's ADA is flashing bullish signals as derivatives traders pile in—open interest surges to $1.44 billion, setting the stage for a potential breakout.
Why the smart money's betting on ADA
With institutional-grade DeFi integrations and a staking yield that still beats traditional savings accounts (take that, Wall Street), Cardano's network activity mirrors its climbing open interest. The crowd’s leaning long—but can ADA deliver?
Key levels to watch
Technical analysts note clean support holds at last week’s swing low, while a decisive close above the August high could trigger algorithmic buying sprees. Just remember: in crypto, 'irrational exuberance' isn’t a bug—it’s a feature.
Cardano’s derivatives data shows a bullish bias
Futures’ OI in Cardano at exchanges rose from $1.20 billion on August 3 to $1.44 billion on Monday, the highest level since the end of July, and has been consistently rising. Rising OI represents new or additional money entering the market and new buying, which could fuel the current ADA price rally.
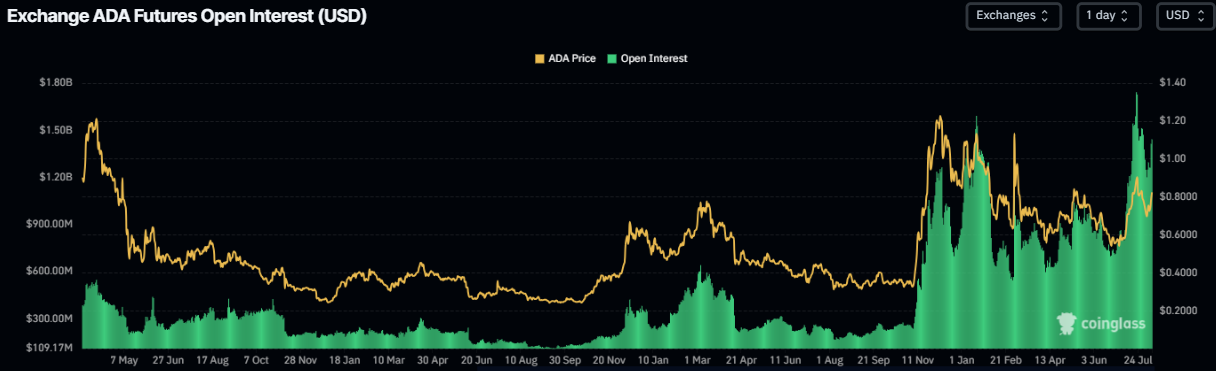
Cardano’s Open Interest chart. Source: Coinglass
Apart from the rising OI, Cardano’s funding rate has flipped into a positive rate last week and has been constantly moving up, indicating that longs are paying shorts. This positive rate indicates a bullish sentiment in the market, and historically, such sharp reversals from negative to positive have often coincided with strong rallies in Cardano’s price.
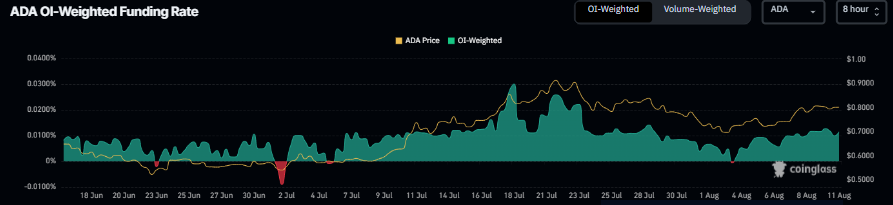
Cardano’s funding rate chart. Source: Coinglass
Cardano Price Forecast: Momentum indicators show bullish bias
Cardano price found support around its key level at $0.70 on August 3 and rallied nearly 15% until Sunday. At the time of writing on Monday, it continues to extend its gains by 3% trading above $0.82.
If ADA continues its upward trend and closes above its daily resistance at $0.84 on a daily basis, it could extend the rally towards its July 21 high of $0.93.
The momentum indicators further support the bullish thesis. On the daily chart, the Relative Strength Index (RSI) reads 61, above its neutral value at 50, suggesting bullish momentum is gaining traction. Additionally, the Moving Average Convergence Divergence (MACD) indicator is currently showing a bullish crossover, giving buy signals and suggesting the start of an upward trend.
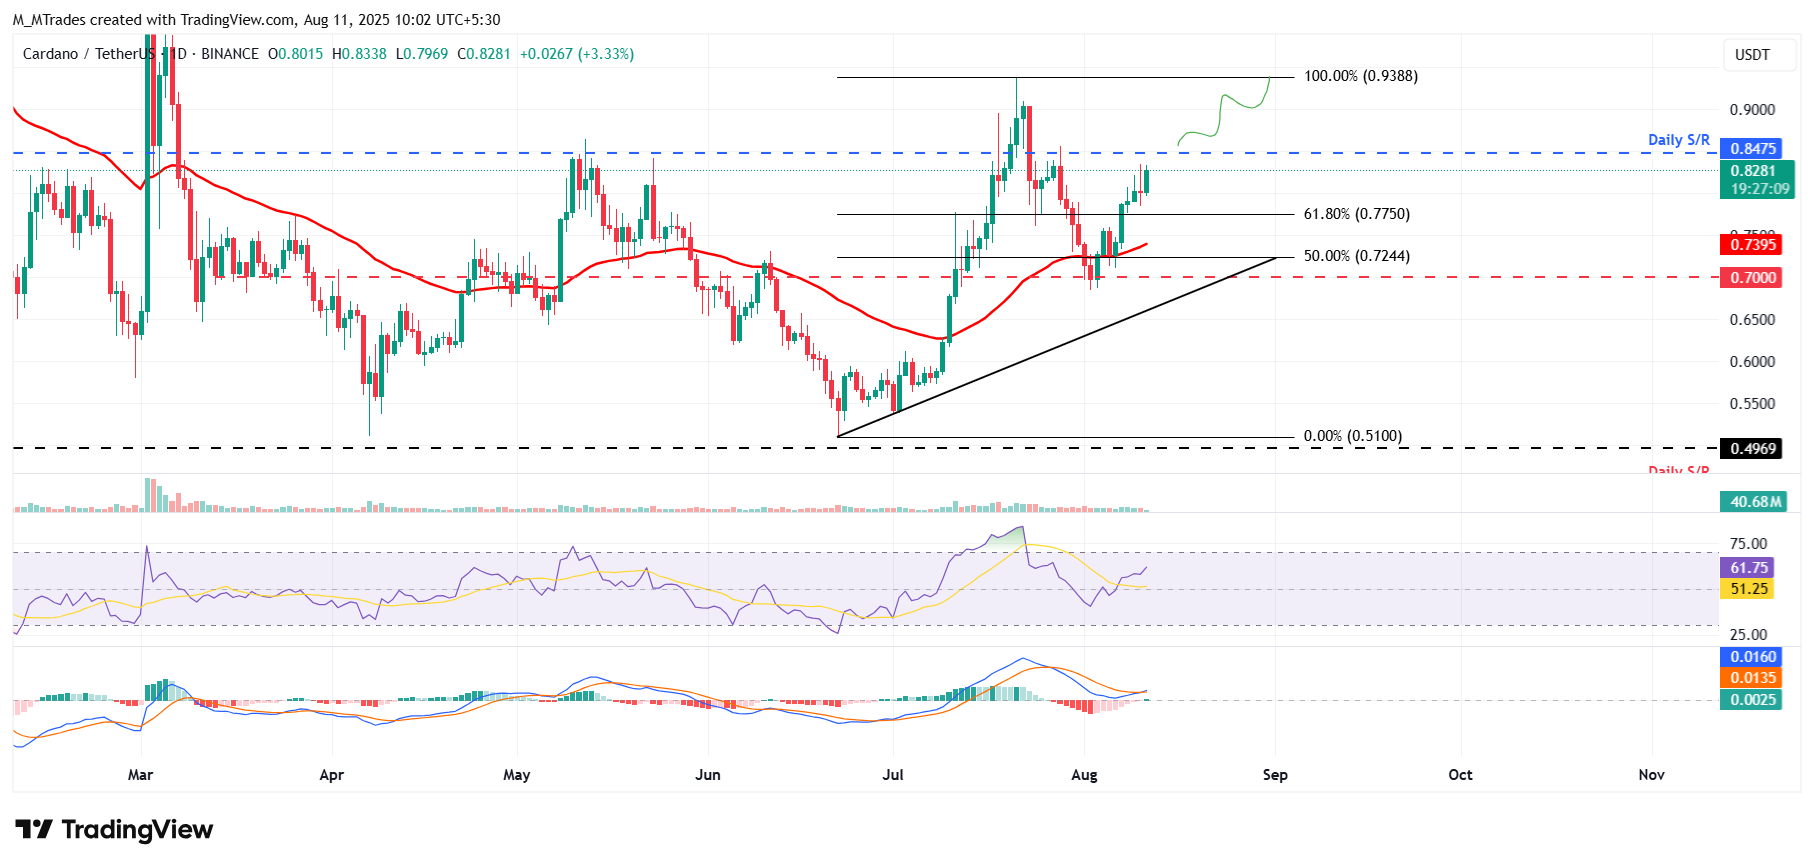
ADA/USDT daily chart
However, if ADA fails to close above the daily resistance at $0.84 and faces a correction, it could extend the decline to find support around its 61.80% Fibonacci retracement level at $0.77.
