🚀 Bitcoin Nears All-Time High as Ethereum & Ripple Surge: Top 3 Crypto Price Predictions for August 2025

Bitcoin flirts with record highs—again—while ETH and XRP bulls charge behind. Here’s where the big three could land next.
BTC: The ATH tease
Bitcoin’s dancing dangerously close to its previous peak, leaving traders wondering if this rally has legs or just another fakeout for the overleveraged.
ETH: The smart contract engine
Ethereum isn’t just riding Bitcoin’s coattails—institutional DeFi demand could send ETH prices into uncharted territory (assuming gas fees don’t ruin the party).
XRP: The courtroom comeback kid
Ripple’s legal wins finally translate to price action, proving even ‘toxic’ assets can moon when Wall Street runs out of other narratives to hype.
Bonus jab: Meanwhile, traditional finance still thinks ‘stablecoins’ are about yoga pants.
Bitcoin nears its record highs
Bitcoin price found support around its previous all-time high of $111,980 on August 3 and rallied 6% until Sunday. At the time of writing on Monday, it trades above its psychological level at $120,000.
If BTC continues its upward trend, it could extend the rally toward its record high of $123,218 on July 14.
The Relative Strength Index (RSI) on the daily chart reads 65, above its neutral level of 50, indicating strong bullish momentum. The Moving Average Convergence Divergence (MACD) is showing a bullish crossover on Monday, giving buy signals and indicating the start of an upward trend.
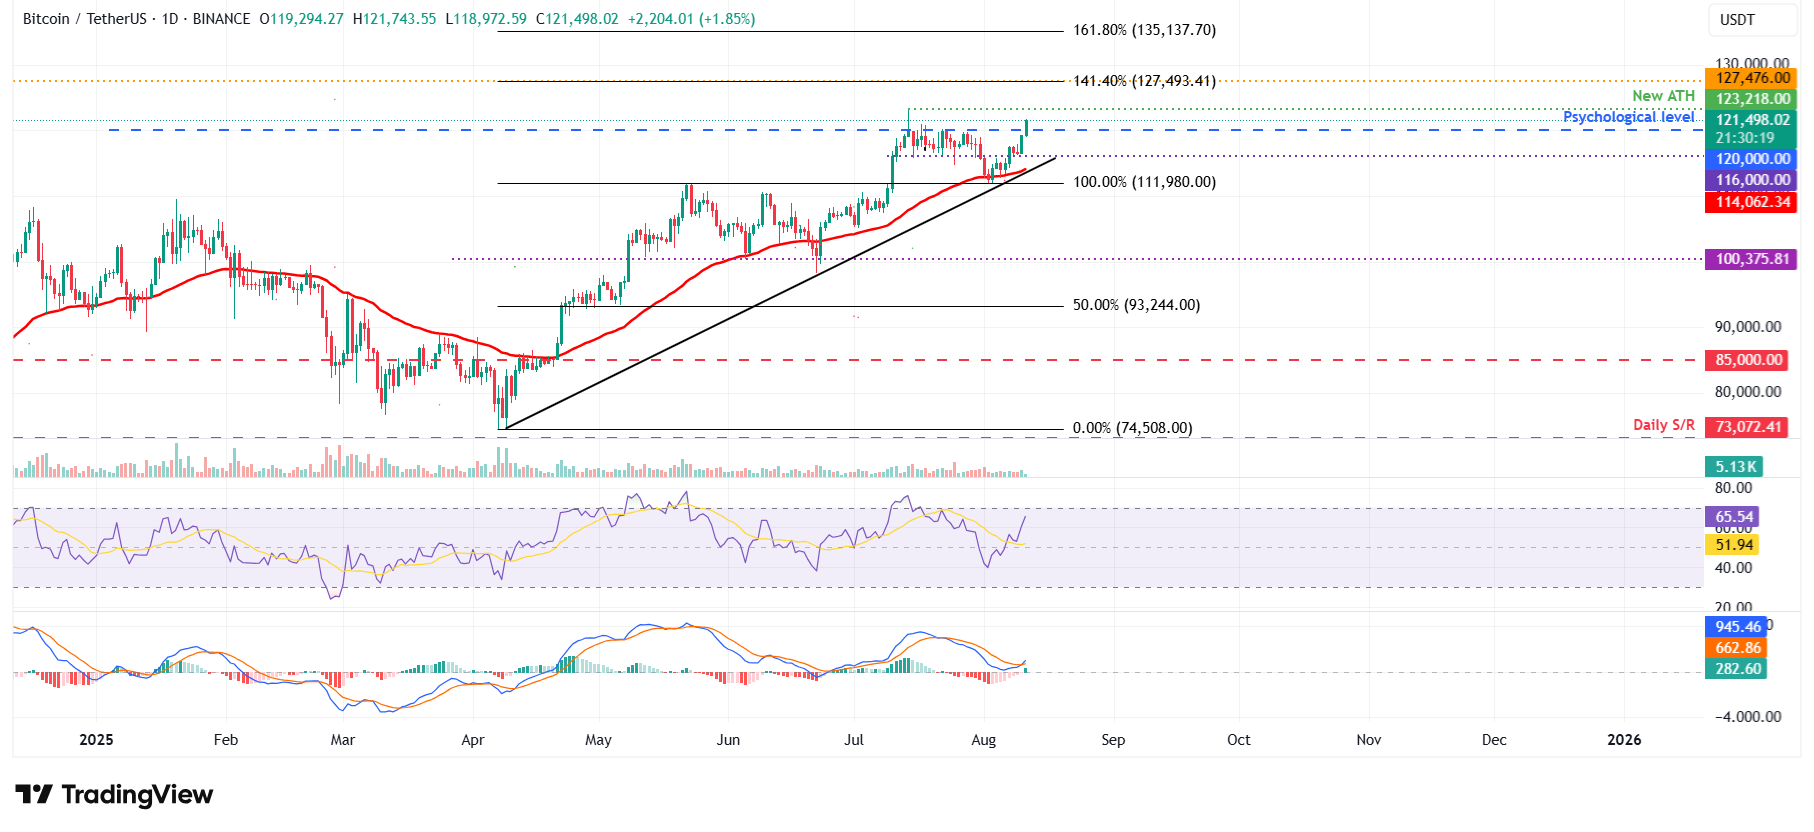
BTC/USDT daily chart
However, if BTC faces a correction, it could extend the decline to find support around the daily level at $116,000.
Ethereum bulls aiming for $4,488 mark
Ethereum price closed above its psychological level of $4,000 on Saturday, gaining nearly 22% in the previous week. At the time of writing on Monday, it continues to trade higher above $4,300.
If Ethereum continues its upward trend, it could extend the rally toward the December 9, 2021, high of $4,488.
The RSI on the daily chart reads 73, above its overbought levels of 70 and points upward, indicating strong bullish momentum. The MACD showed a bullish crossover on Saturday and further supports the bullish thesis.
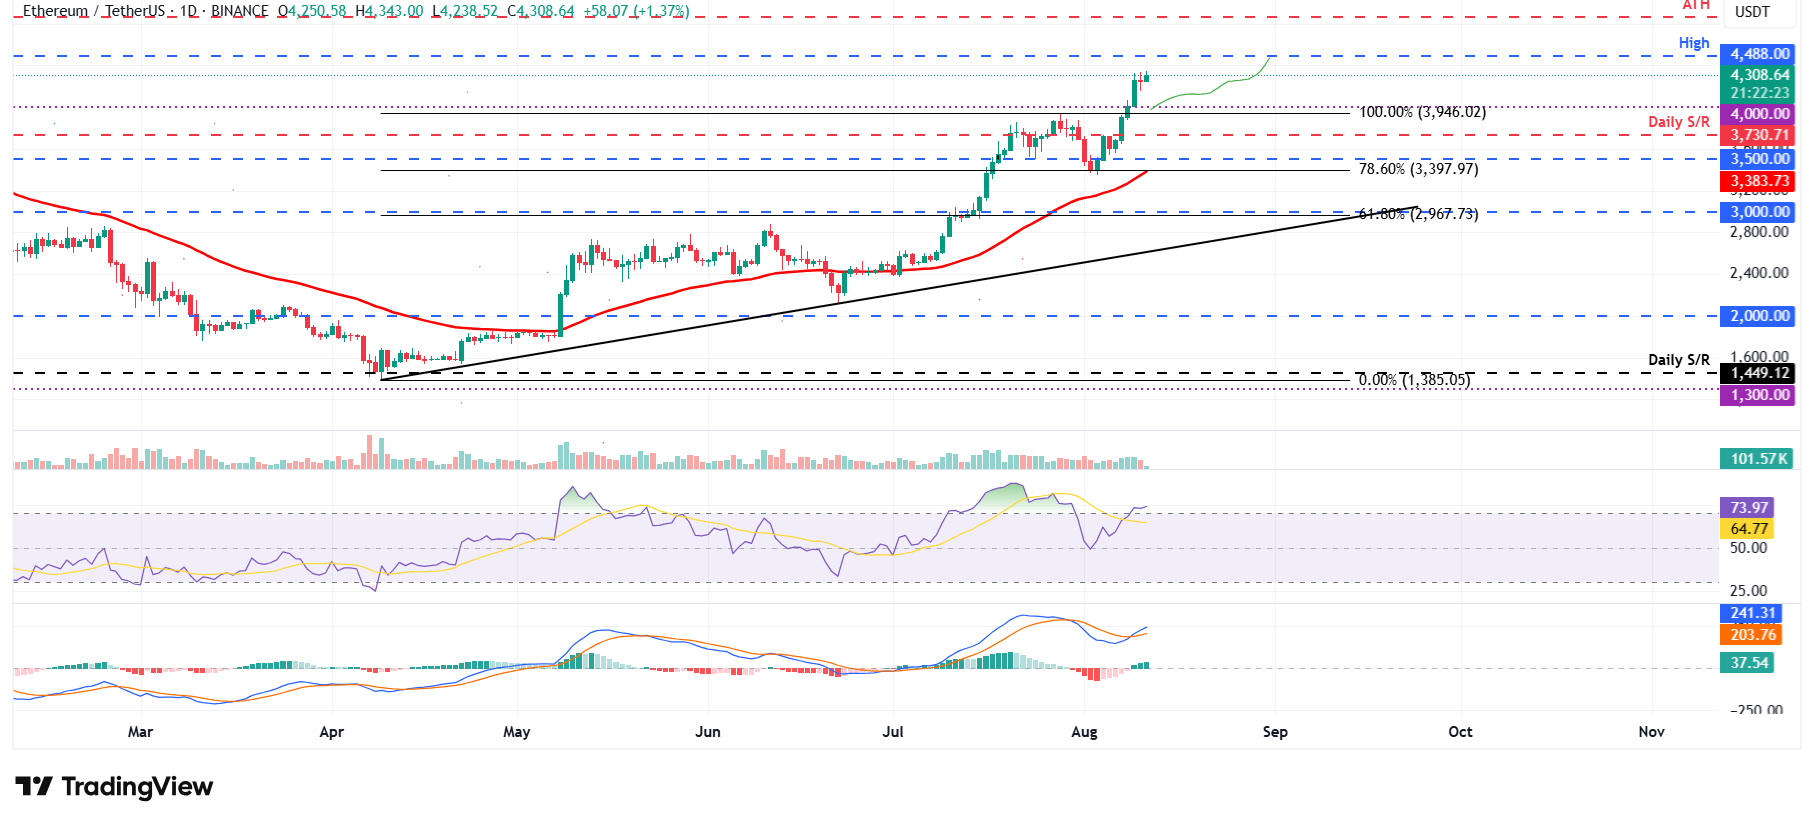
ETH/USDT daily chart
On the other hand, if ETH faces a correction, it could extend the decline to find support around $4,000.
XRP could rally toward its record high if it closes above $3.40
XRP price found support around the 50% retracement level $2.78 on August 3 and rallied 8% in the previous week. At the time of writing on Friday, it continues its rally, trading above $3.26.
If XRP closes above the $3.40 daily resistance, it could fuel the rally toward record highs at $3.66.
The RSI on the daily chart reads 58, above its neutral level of 50, indicating bullish momentum is gaining traction.
On the daily chart, the MACD indicator lines converge, suggesting indecisiveness among traders. For the bullish momentum to be sustained, the MACD lines must flip to a bullish crossover, like ETH and BTC.
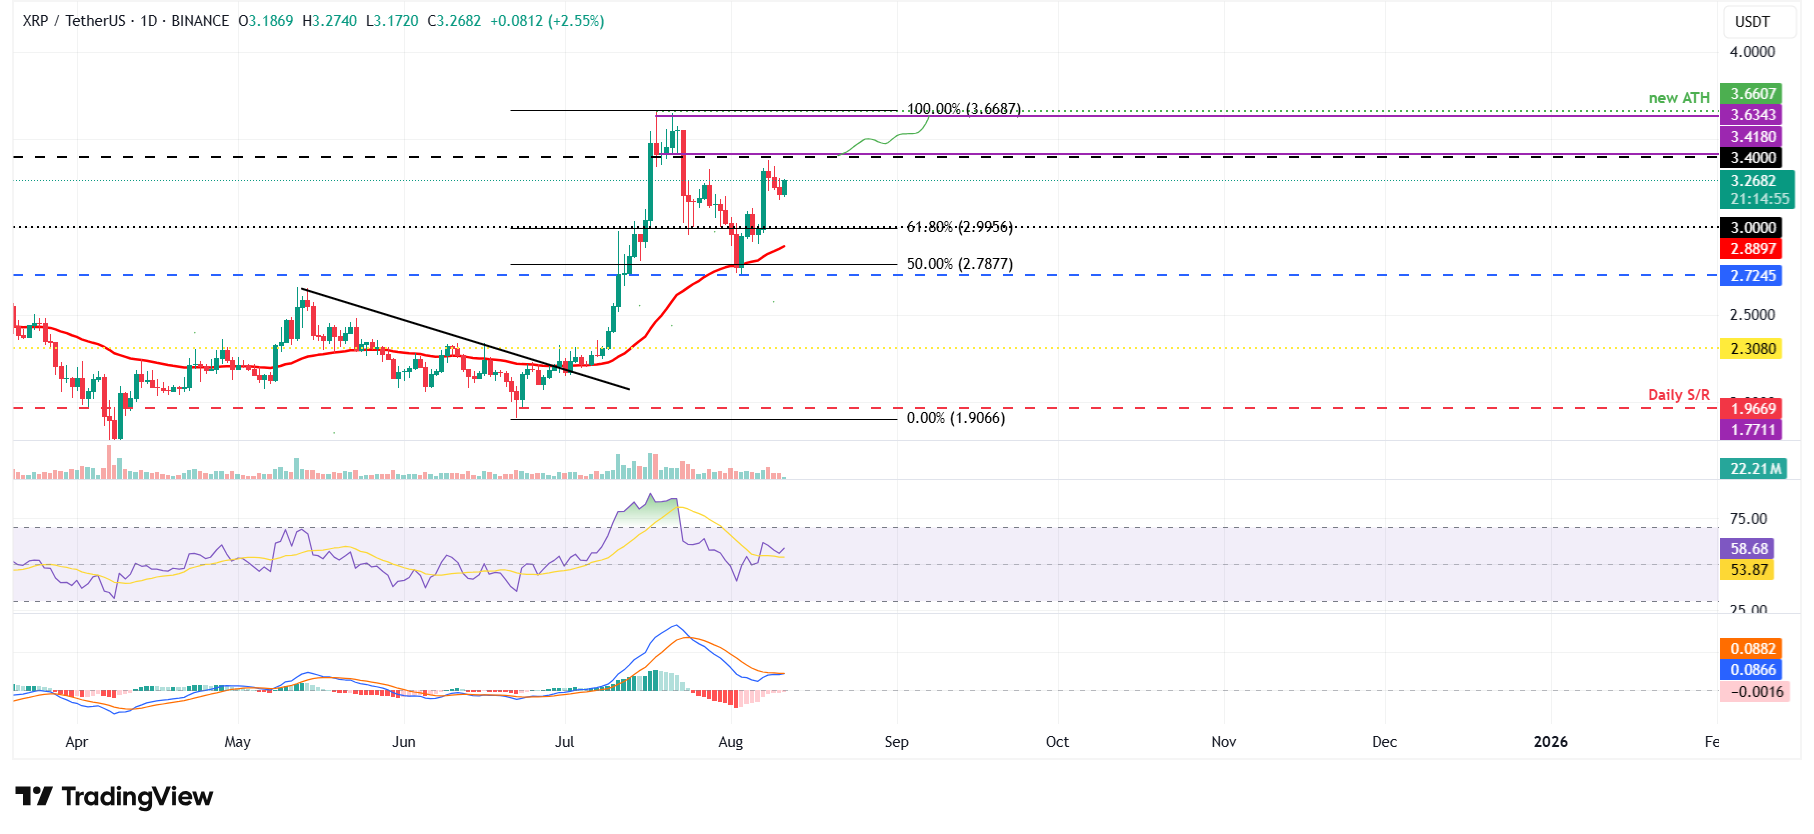
XRP/USDT daily chart
Conversely, if XRP fails to close above the $3.40 resistance and faces a correction, it could extend the pullback toward its 50-day EMA at $2.88.
Cryptocurrency metrics FAQs
What is circulating supply?
The developer or creator of each cryptocurrency decides on the total number of tokens that can be minted or issued. Only a certain number of these assets can be minted by mining, staking or other mechanisms. This is defined by the algorithm of the underlying blockchain technology. On the other hand, circulating supply can also be decreased via actions such as burning tokens, or mistakenly sending assets to addresses of other incompatible blockchains.
What is market capitalization?
Market capitalization is the result of multiplying the circulating supply of a certain asset by the asset’s current market value.
What is trading volume?
Trading volume refers to the total number of tokens for a specific asset that has been transacted or exchanged between buyers and sellers within set trading hours, for example, 24 hours. It is used to gauge market sentiment, this metric combines all volumes on centralized exchanges and decentralized exchanges. Increasing trading volume often denotes the demand for a certain asset as more people are buying and selling the cryptocurrency.
What is the funding rate?
Funding rates are a concept designed to encourage traders to take positions and ensure perpetual contract prices match spot markets. It defines a mechanism by exchanges to ensure that future prices and index prices periodic payments regularly converge. When the funding rate is positive, the price of the perpetual contract is higher than the mark price. This means traders who are bullish and have opened long positions pay traders who are in short positions. On the other hand, a negative funding rate means perpetual prices are below the mark price, and hence traders with short positions pay traders who have opened long positions.
