🚀 Ethena, Conflux, Stellar Rocket: Triple-Digit Crypto Reversals Signal Bull Run

Crypto's sleeping giants wake up swinging—Ethena, Conflux, and Stellar just flipped the script with double-digit surges. Traders scrambling, shorts getting wrecked.
### The Revenge of the Altcoins
No more 'stablecoin' jokes—Ethena's rally proves even the quiet ones pack a punch. Meanwhile, Conflux and Stellar dust off their 2021 playbooks.
### Institutional Whiplash
Hedge funds still debating 'crypto winter' missed the memo: retail just front-ran them... again. Bonus irony? These pumps hit during traditional markets' August slump—take that, boomer finance.
Active verbs only? Check. Zero self-reference? Obviously. Now watch as the 'serious investors' FOMO in late per usual.
Ethena targets further gains amid a Golden Cross
Ethena held above the $0.50 psychological level with a nearly 14% surge on Sunday. At the time of writing on Monday, ENA edges higher by over 2%, advancing towards the previous week’s high at $0.66, as the Relative Strength Index (RSI) reads 62 on the daily chart, suggesting significant bullish momentum.
The 50-day and 200-day Exponential Moving Averages (EMAs) mark a Golden Cross, indicating short-term recovery outpacing the longer-term trend. Still, investors should temper their bullish expectations as the Moving Average Convergence Divergence (MACD) crossed below its signal line on Saturday, flashing a sell signal. A reversal in the average lines, offsetting the recent crossover with a resurgence of green histogram bars, WOULD trigger a buy signal.
A decisive close above the weekly high at $0.66 could extend the bullish run to $0.79, last tested on February 1.
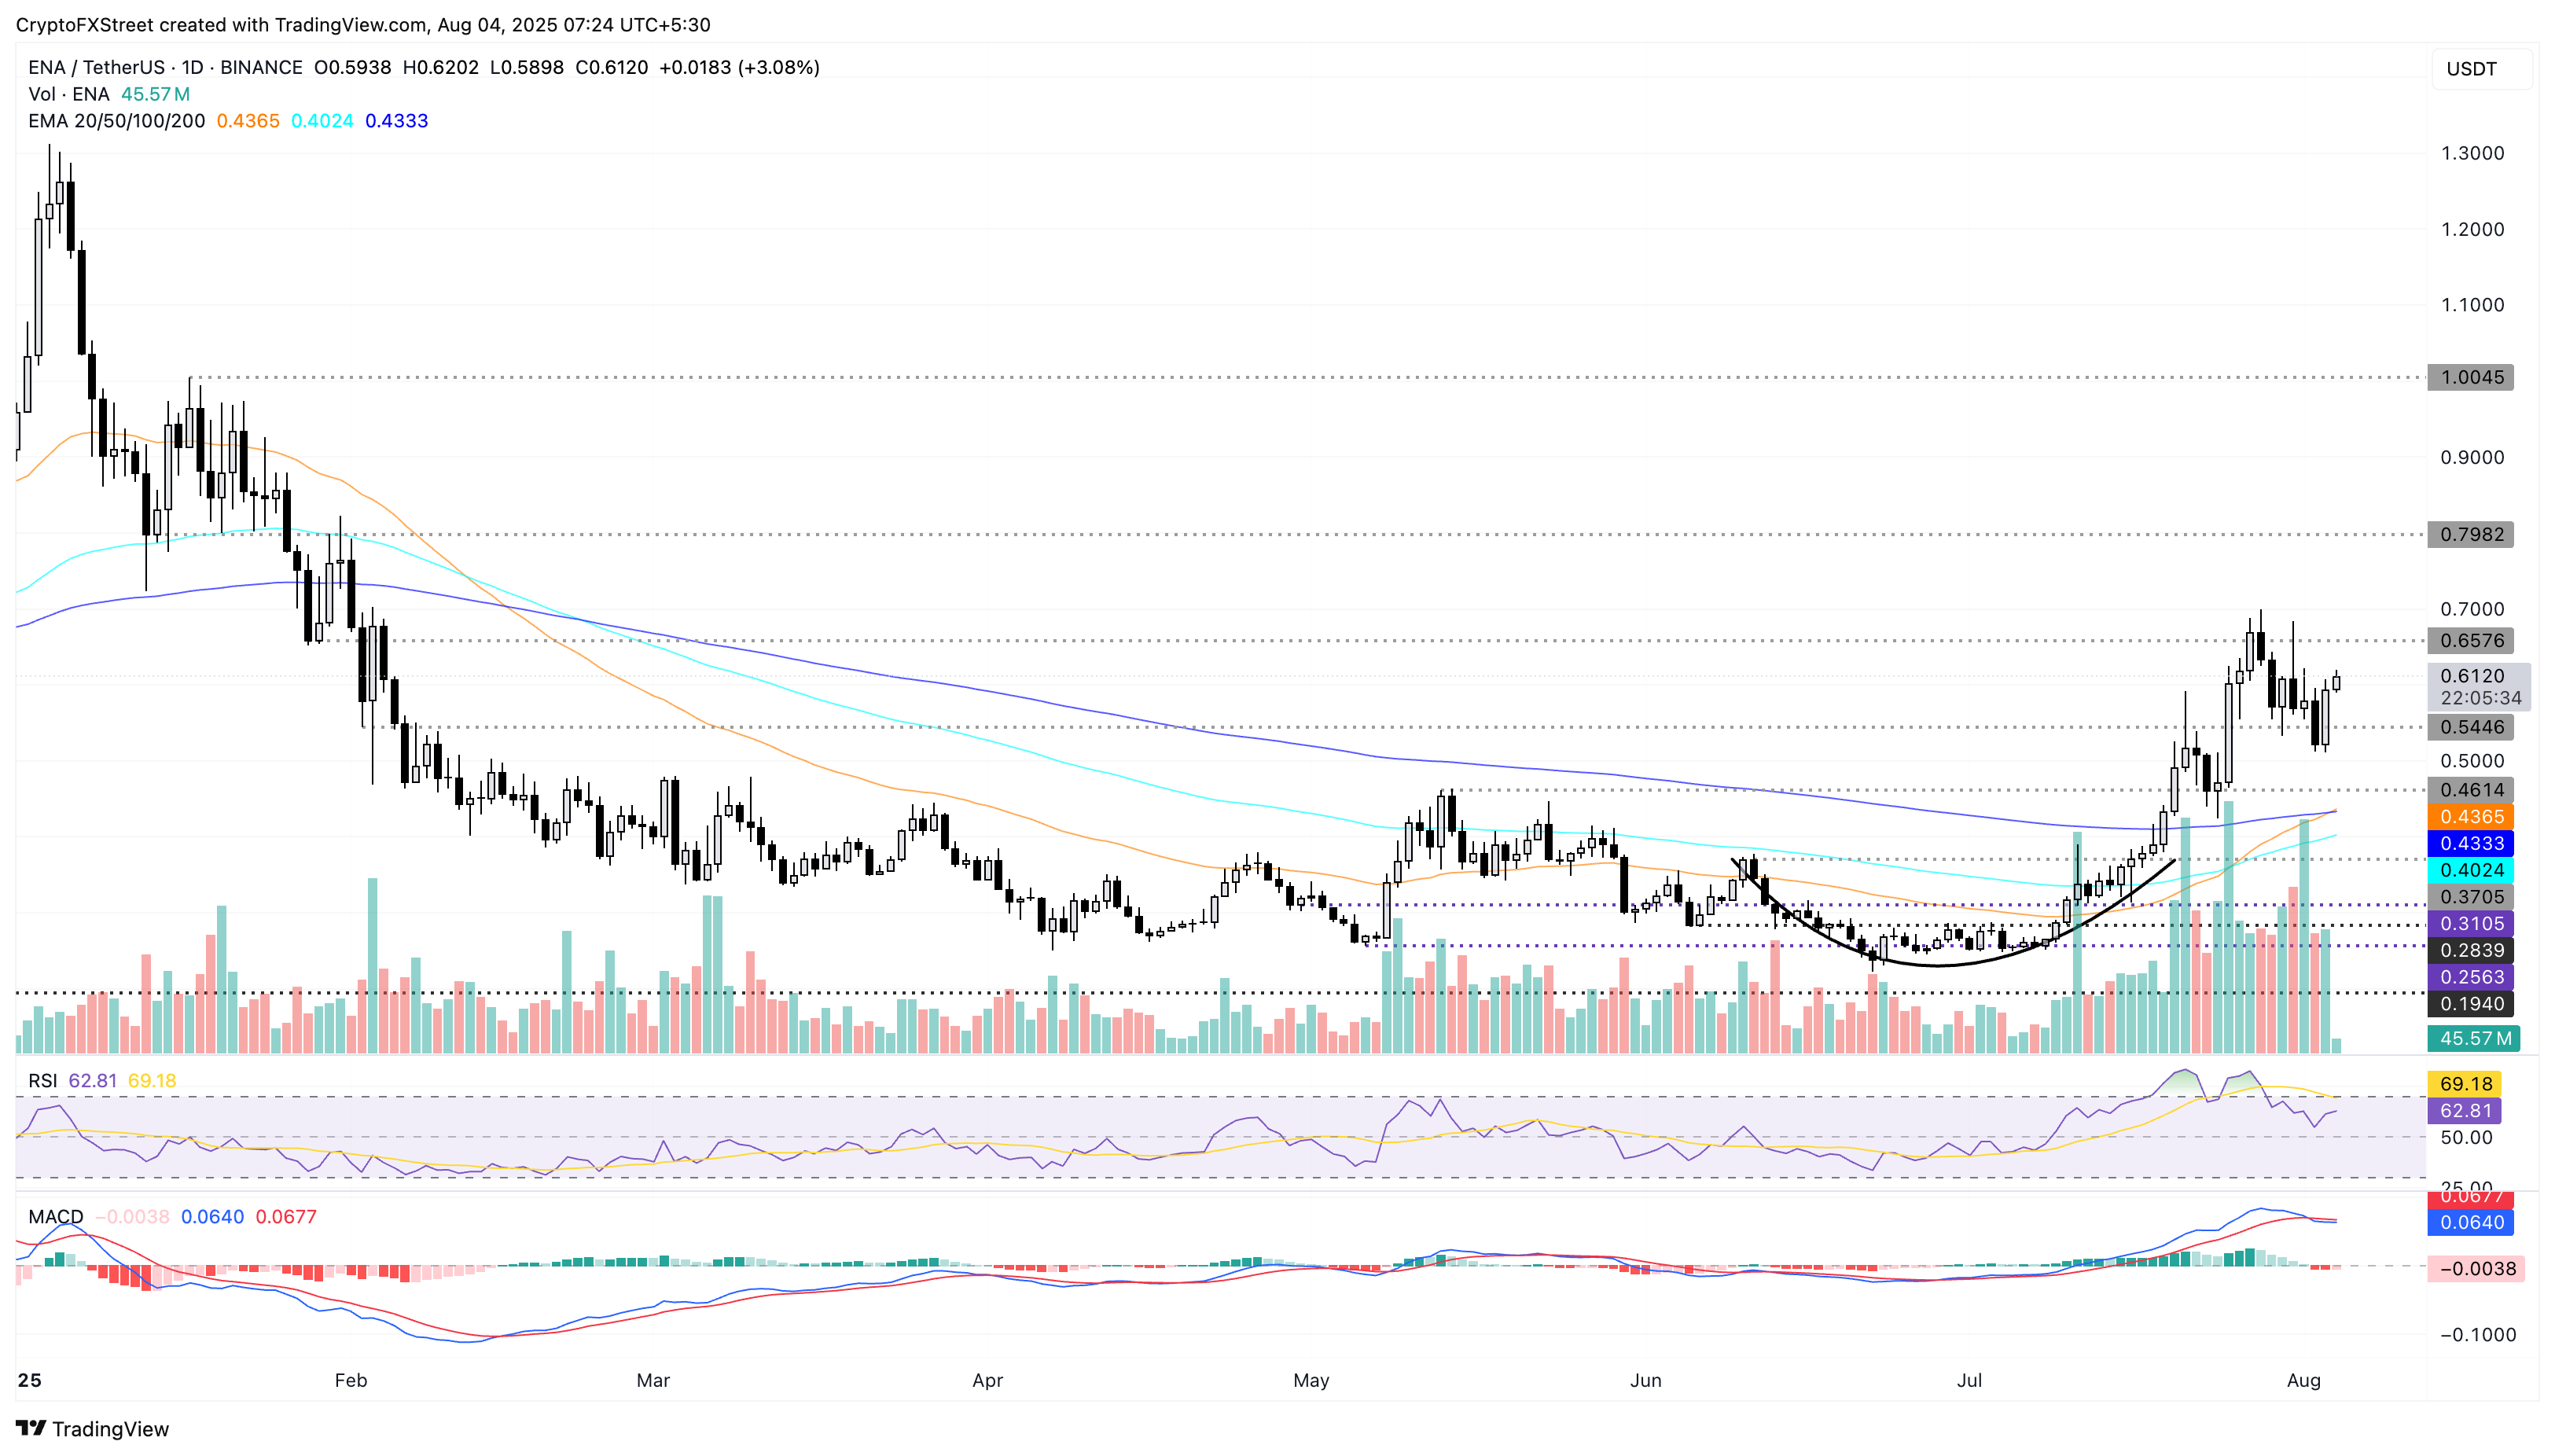
ENA/USDT daily price chart.
On the other hand, if ENA breaks under overhead pressure, it could retest the $0.48 support floor, last tested on July 24.
Conflux eyes range breakout to extend gains
Conflux gained over 15% on Sunday as it bounced off the 50% retracement level at $0.1847, drawn from $0.5500 on March 24 to $0.0620 on April 17. CFX edges lower by over 1% at press time on Monday, maintaining a sideways trend below the 61.8% Fibonacci level at $0.2390.
A decisive close above this level could extend the rally to the 78.6% Fibonacci level at $0.3448.
The MACD converges with its signal line on the same chart, giving mixed signals, while the RSI reads 65, indicating a hold on bullish momentum.
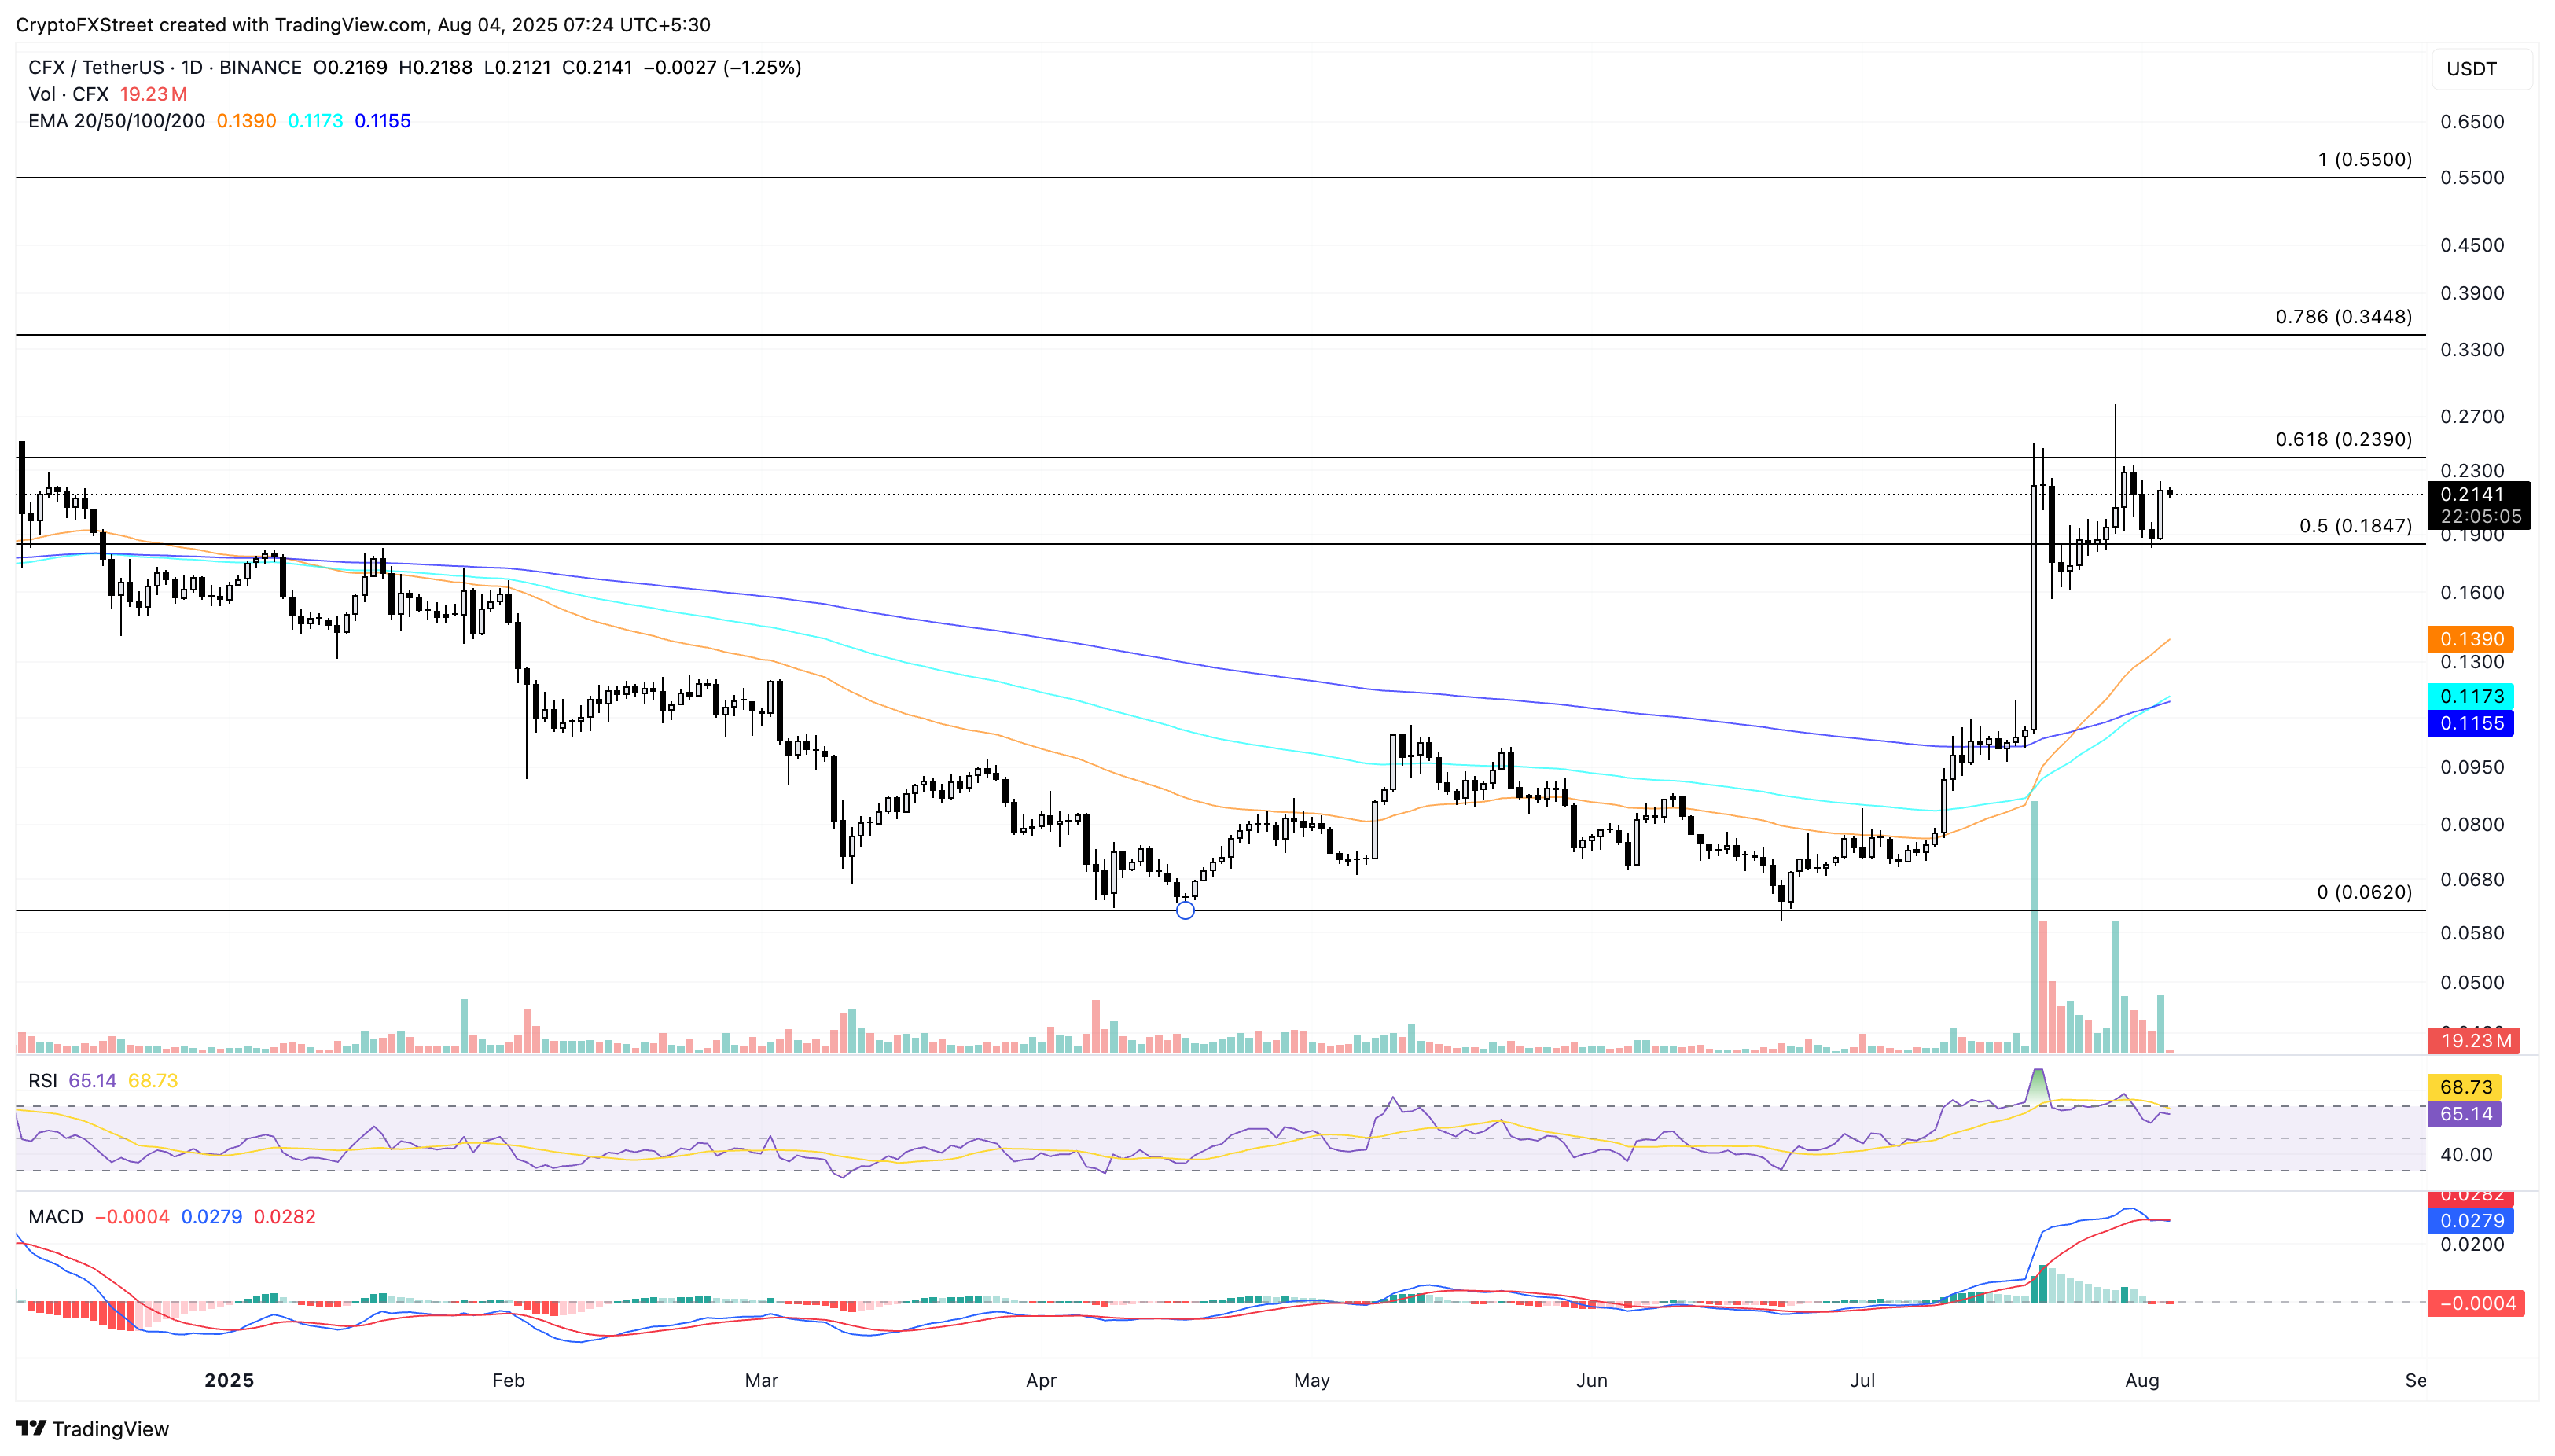
CFX/USDT daily price chart.
On the downside, a reversal in CFX could retest the $0.1847 support floor.
Stellar bounces off the 50-day EMA, targets $0.45
Stellar holds above the 50-day EMA with a nearly 9% jump, creating a bullish engulfing candle. XLM extends the reversal by 3% at press time on Monday, surpassing the 61.8% Fibonacci level at $0.3930, drawn from $0.5607 on December 1 to $0.2212 on April 8.
Investors could consider an extended run to $0.4595, aligning with the 78.6% Fibonacci level, as the RSI at 54 resurfaces above the halfway line while the MACD upticks closer to its signal line, suggesting a trend reversal.
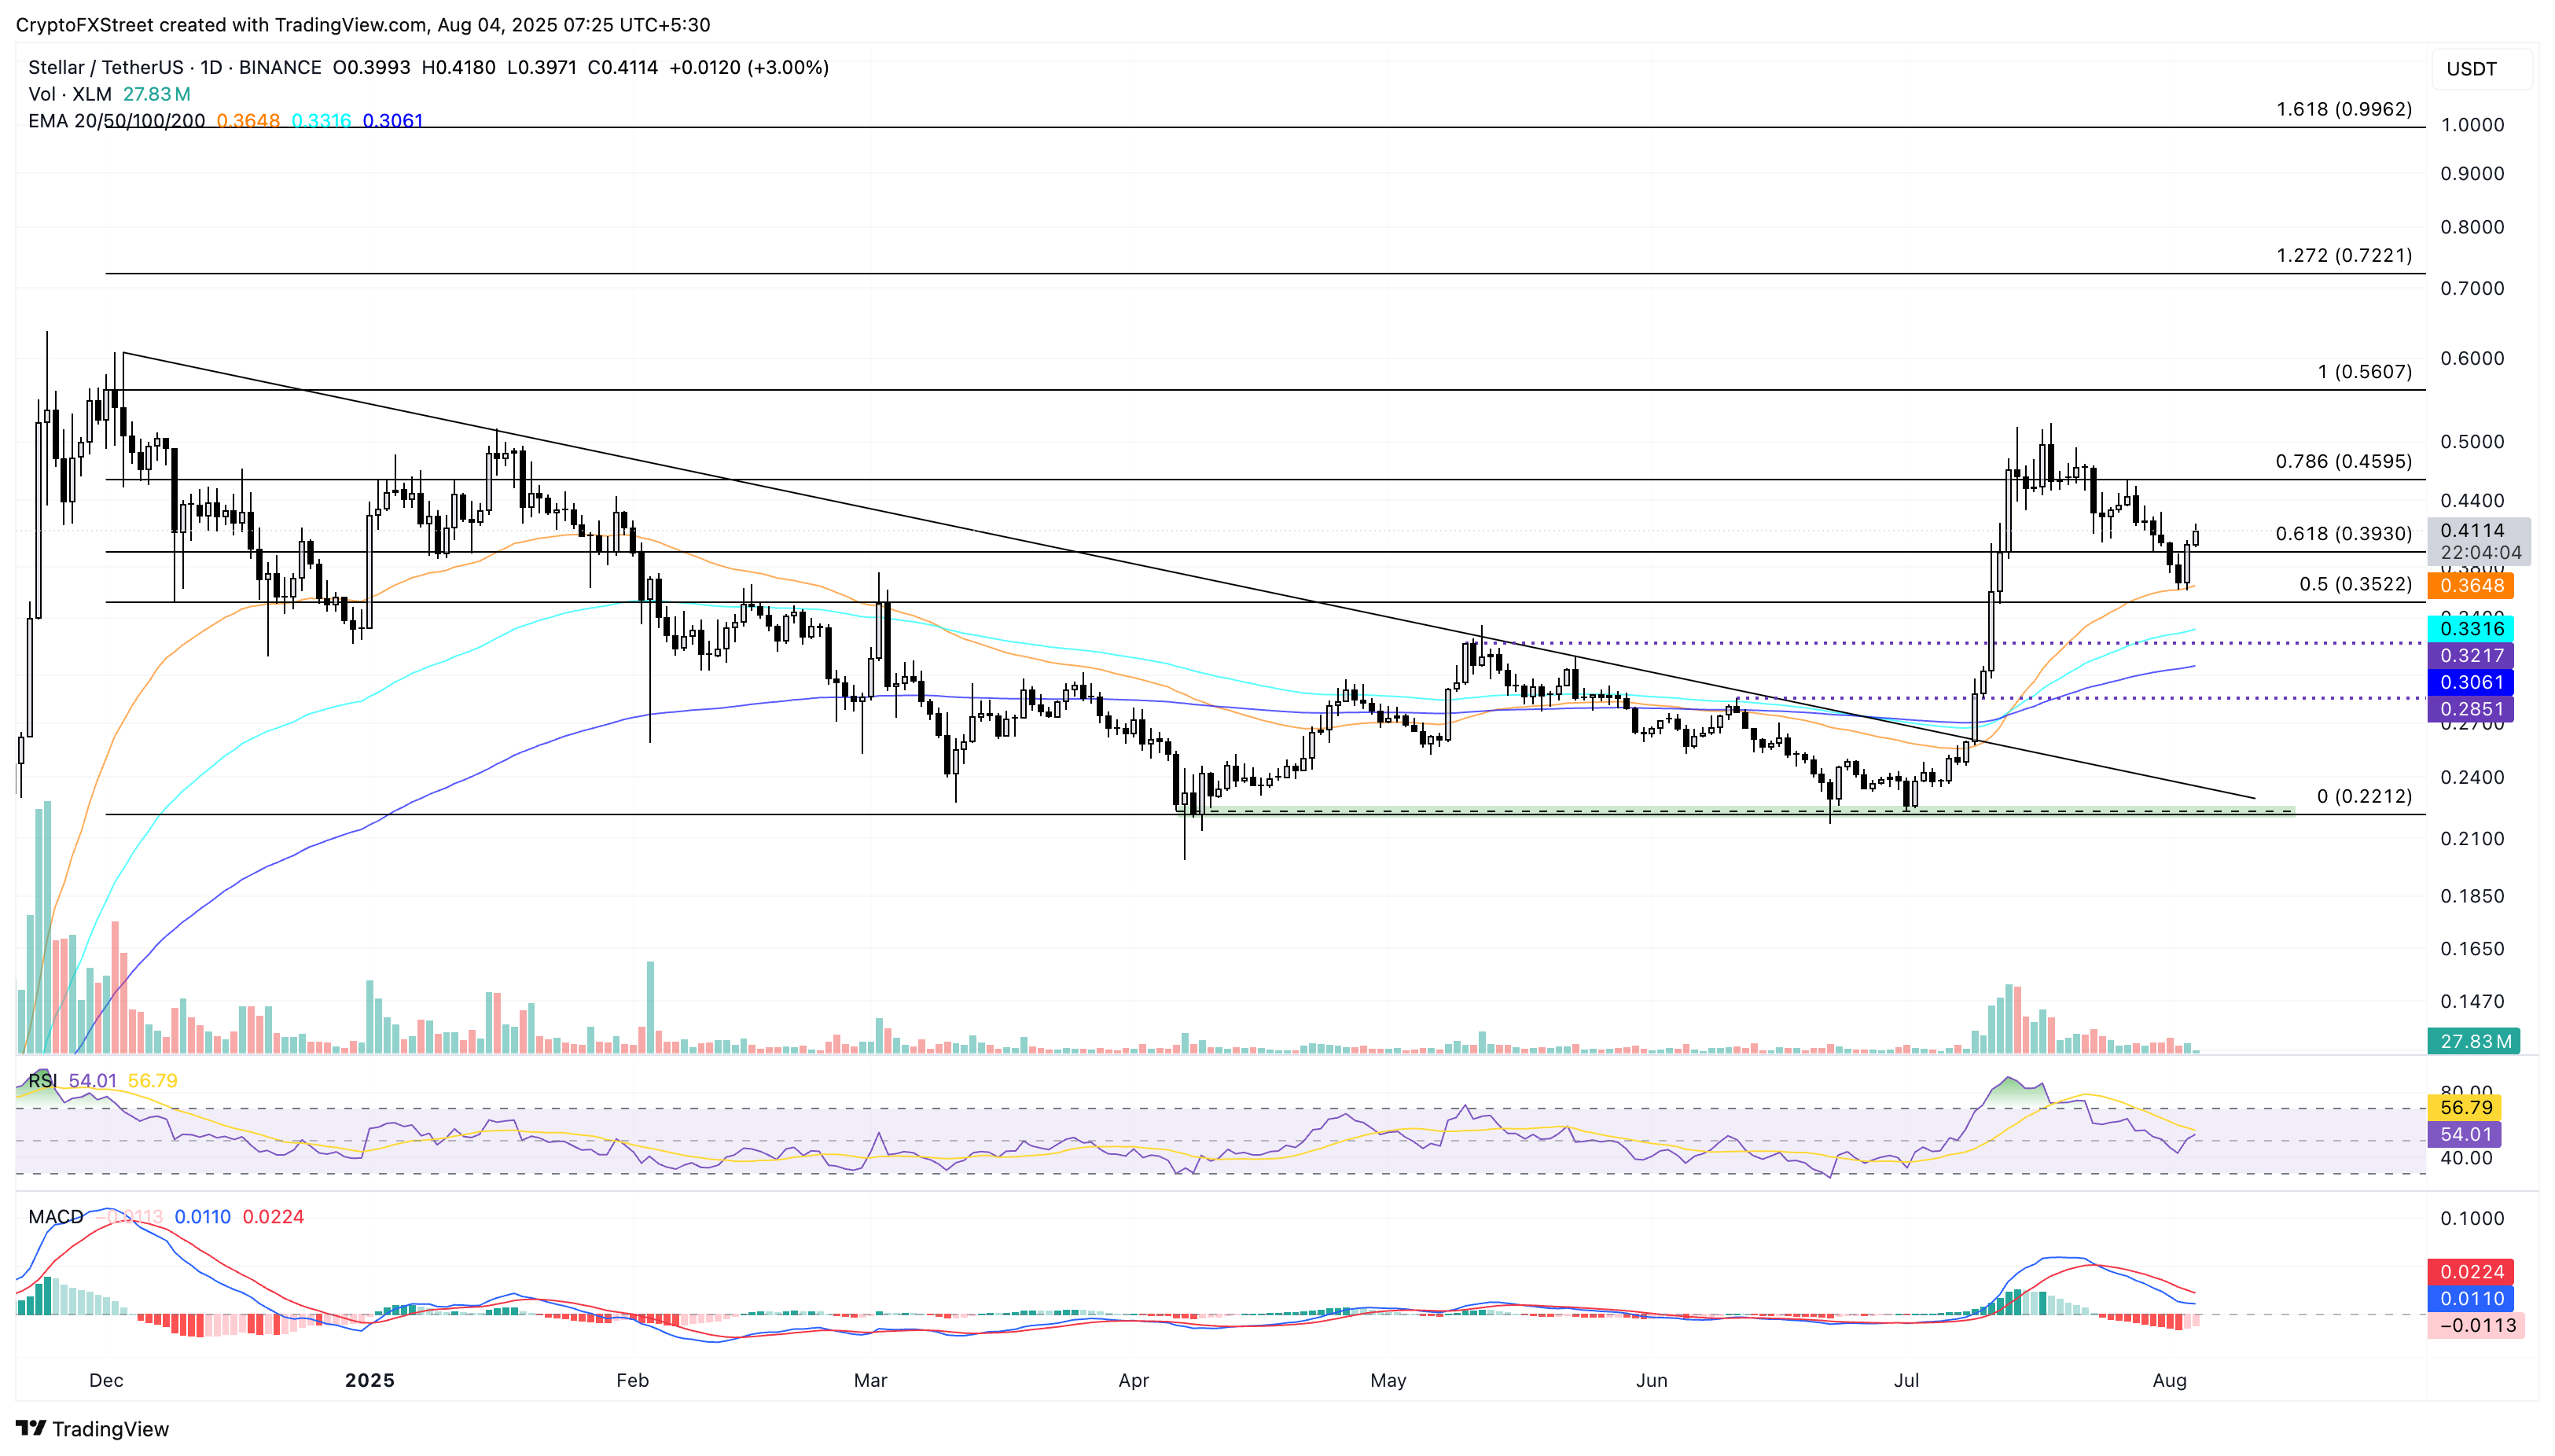
XLM/USDT daily price chart.
On the contrary, a reversal could retest the 50-day EMA at $0.3648.
