SPX, VIRTUAL, PENDLE Crash Hard as Bitcoin Traders Cash In—Third Major Profit-Taking Wave Hits

Blood in the streets—again. SPX, VIRTUAL, and PENDLE lead the crypto carnage as Bitcoin whales dump holdings for the third time this cycle. Is this a healthy correction or the start of something uglier?
Profit-booking frenzy rattles altcoins
While Bitcoin’s dip grabs headlines, the real pain’s in altcoins. SPX got wrecked, VIRTUAL flatlined, and PENDLE—the recent darling of DeFi degens—got absolutely mauled. Classic case of ‘when Bitcoin sneezes, altcoins catch pneumonia.’
The institutional playbook at work
Three major profit-taking events in Bitcoin’s current cycle suggest smarter money’s playing a different game. They buy the rumor, sell the news—and leave retail holding the bag. Who needs Wall Street when crypto’s this efficient at wealth redistribution?
Silver lining for diamond hands?
Every flushout creates opportunity. If history rhymes, this could be the shakeout before the next leg up. Or it’s the market reminding everyone that in crypto, ‘long-term hold’ often just means ‘didn’t sell at the top.’ Either way—grab your popcorn.
SPX6900 meme coin risks a steeper correction
SPX edges higher by nearly 1% at press time on Friday after four consecutive days of losses. The uptick holds the meme coin above its 50-day Exponential Moving Average (EMA) at $1.55.
The Moving Average Convergence Divergence (MACD) indicator has held a sell signal since Wednesday, marked by the resurgence of red histogram bars below the zero line. If investors continue to exit or increase their bearish exposure, the SPX could extend the decline to the 100-day EMA at $1.29.
Traders should consider tempering bullish expectations, as the Relative Strength Index (RSI) stands at 46 on the daily chart, indicating a decline in buying pressure.
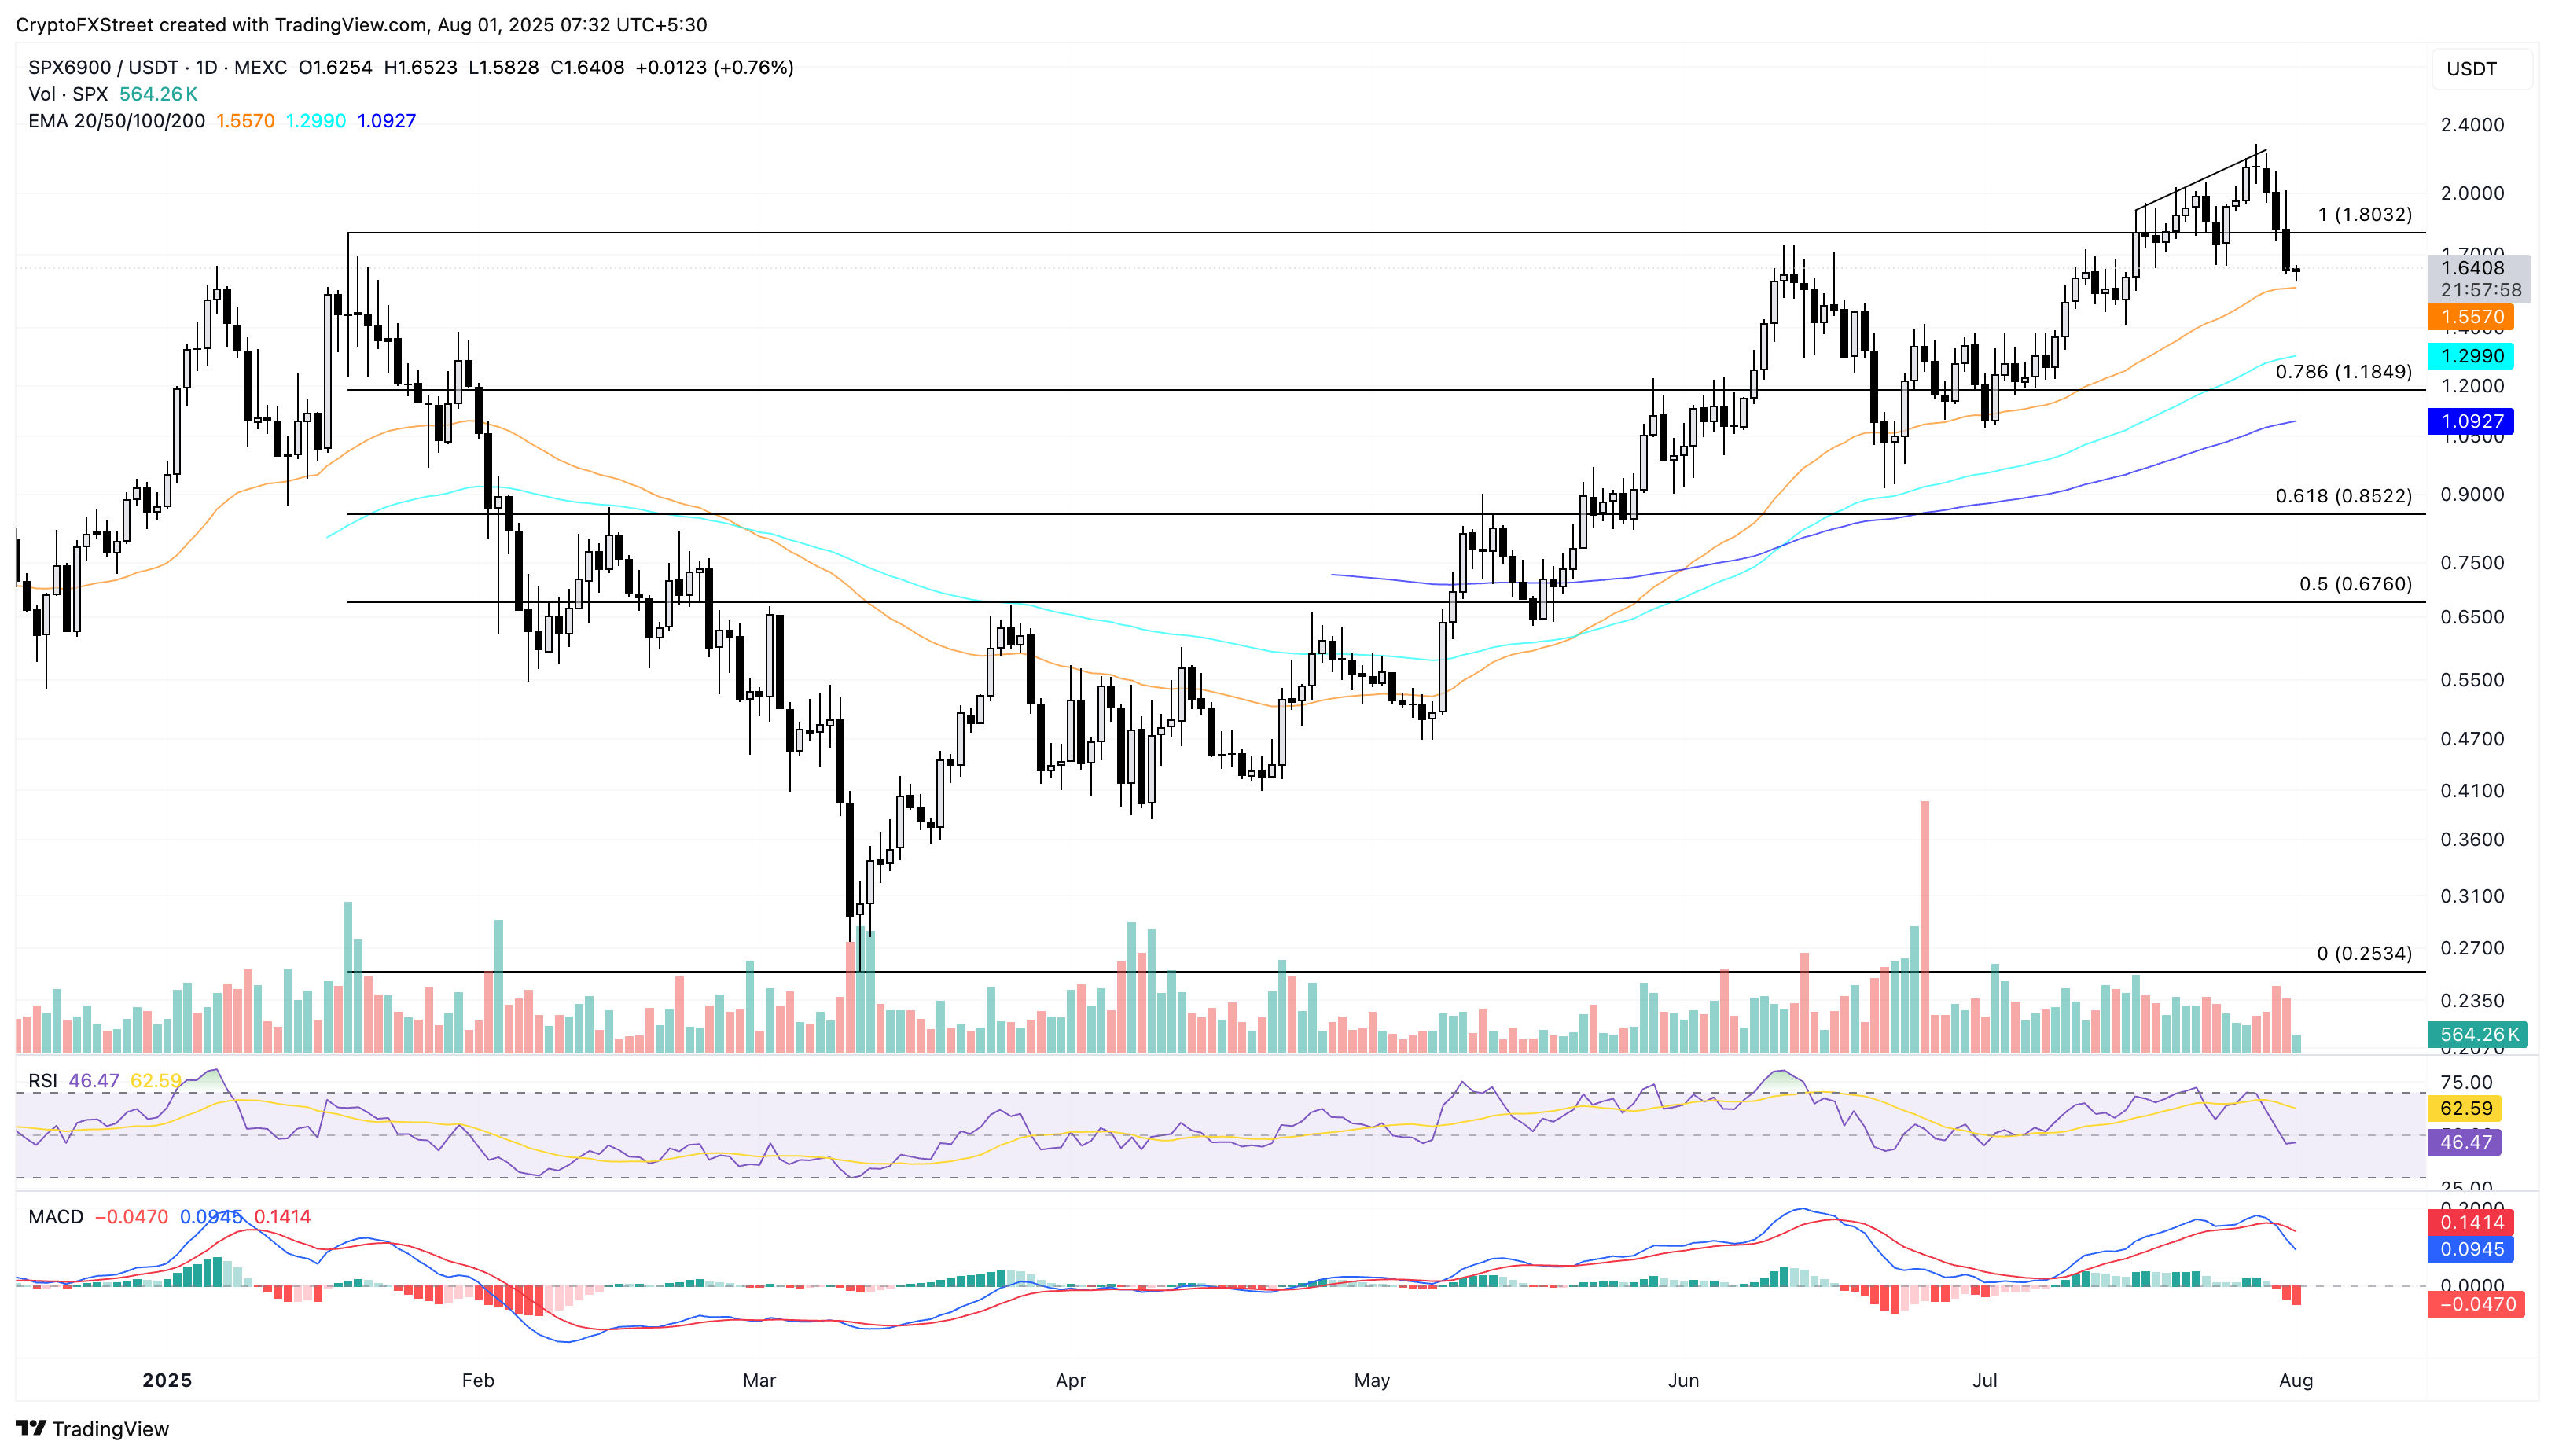
SPX/USDT daily price chart.
On the contrary, a bounce back in SPX could test the $1.80 peak marked on January 19.
VIRTUAL extends the downfall as selling pressure grows
Virtuals Protocol edges lower by over 1% at the time of writing, extending the downtrend for the fifth consecutive day. A nearly 12% drop on July 23, from a resistance trendline formed by connecting the January 2 and May 27 peaks, ignited the ongoing decline.
VIRTUAL falls below the $1.27 support level last tested on Wednesday, underpinned by a potential Death Cross between the declining 50-day and 200-day EMAs. The bearish run targets the $1.04 support level, last tested on April 28.
The technical indicators back the downtrend as the MACD indicator displays successive rises in red histogram bars, and the RSI reading of 31 on the daily chart stands close to the oversold boundary line.
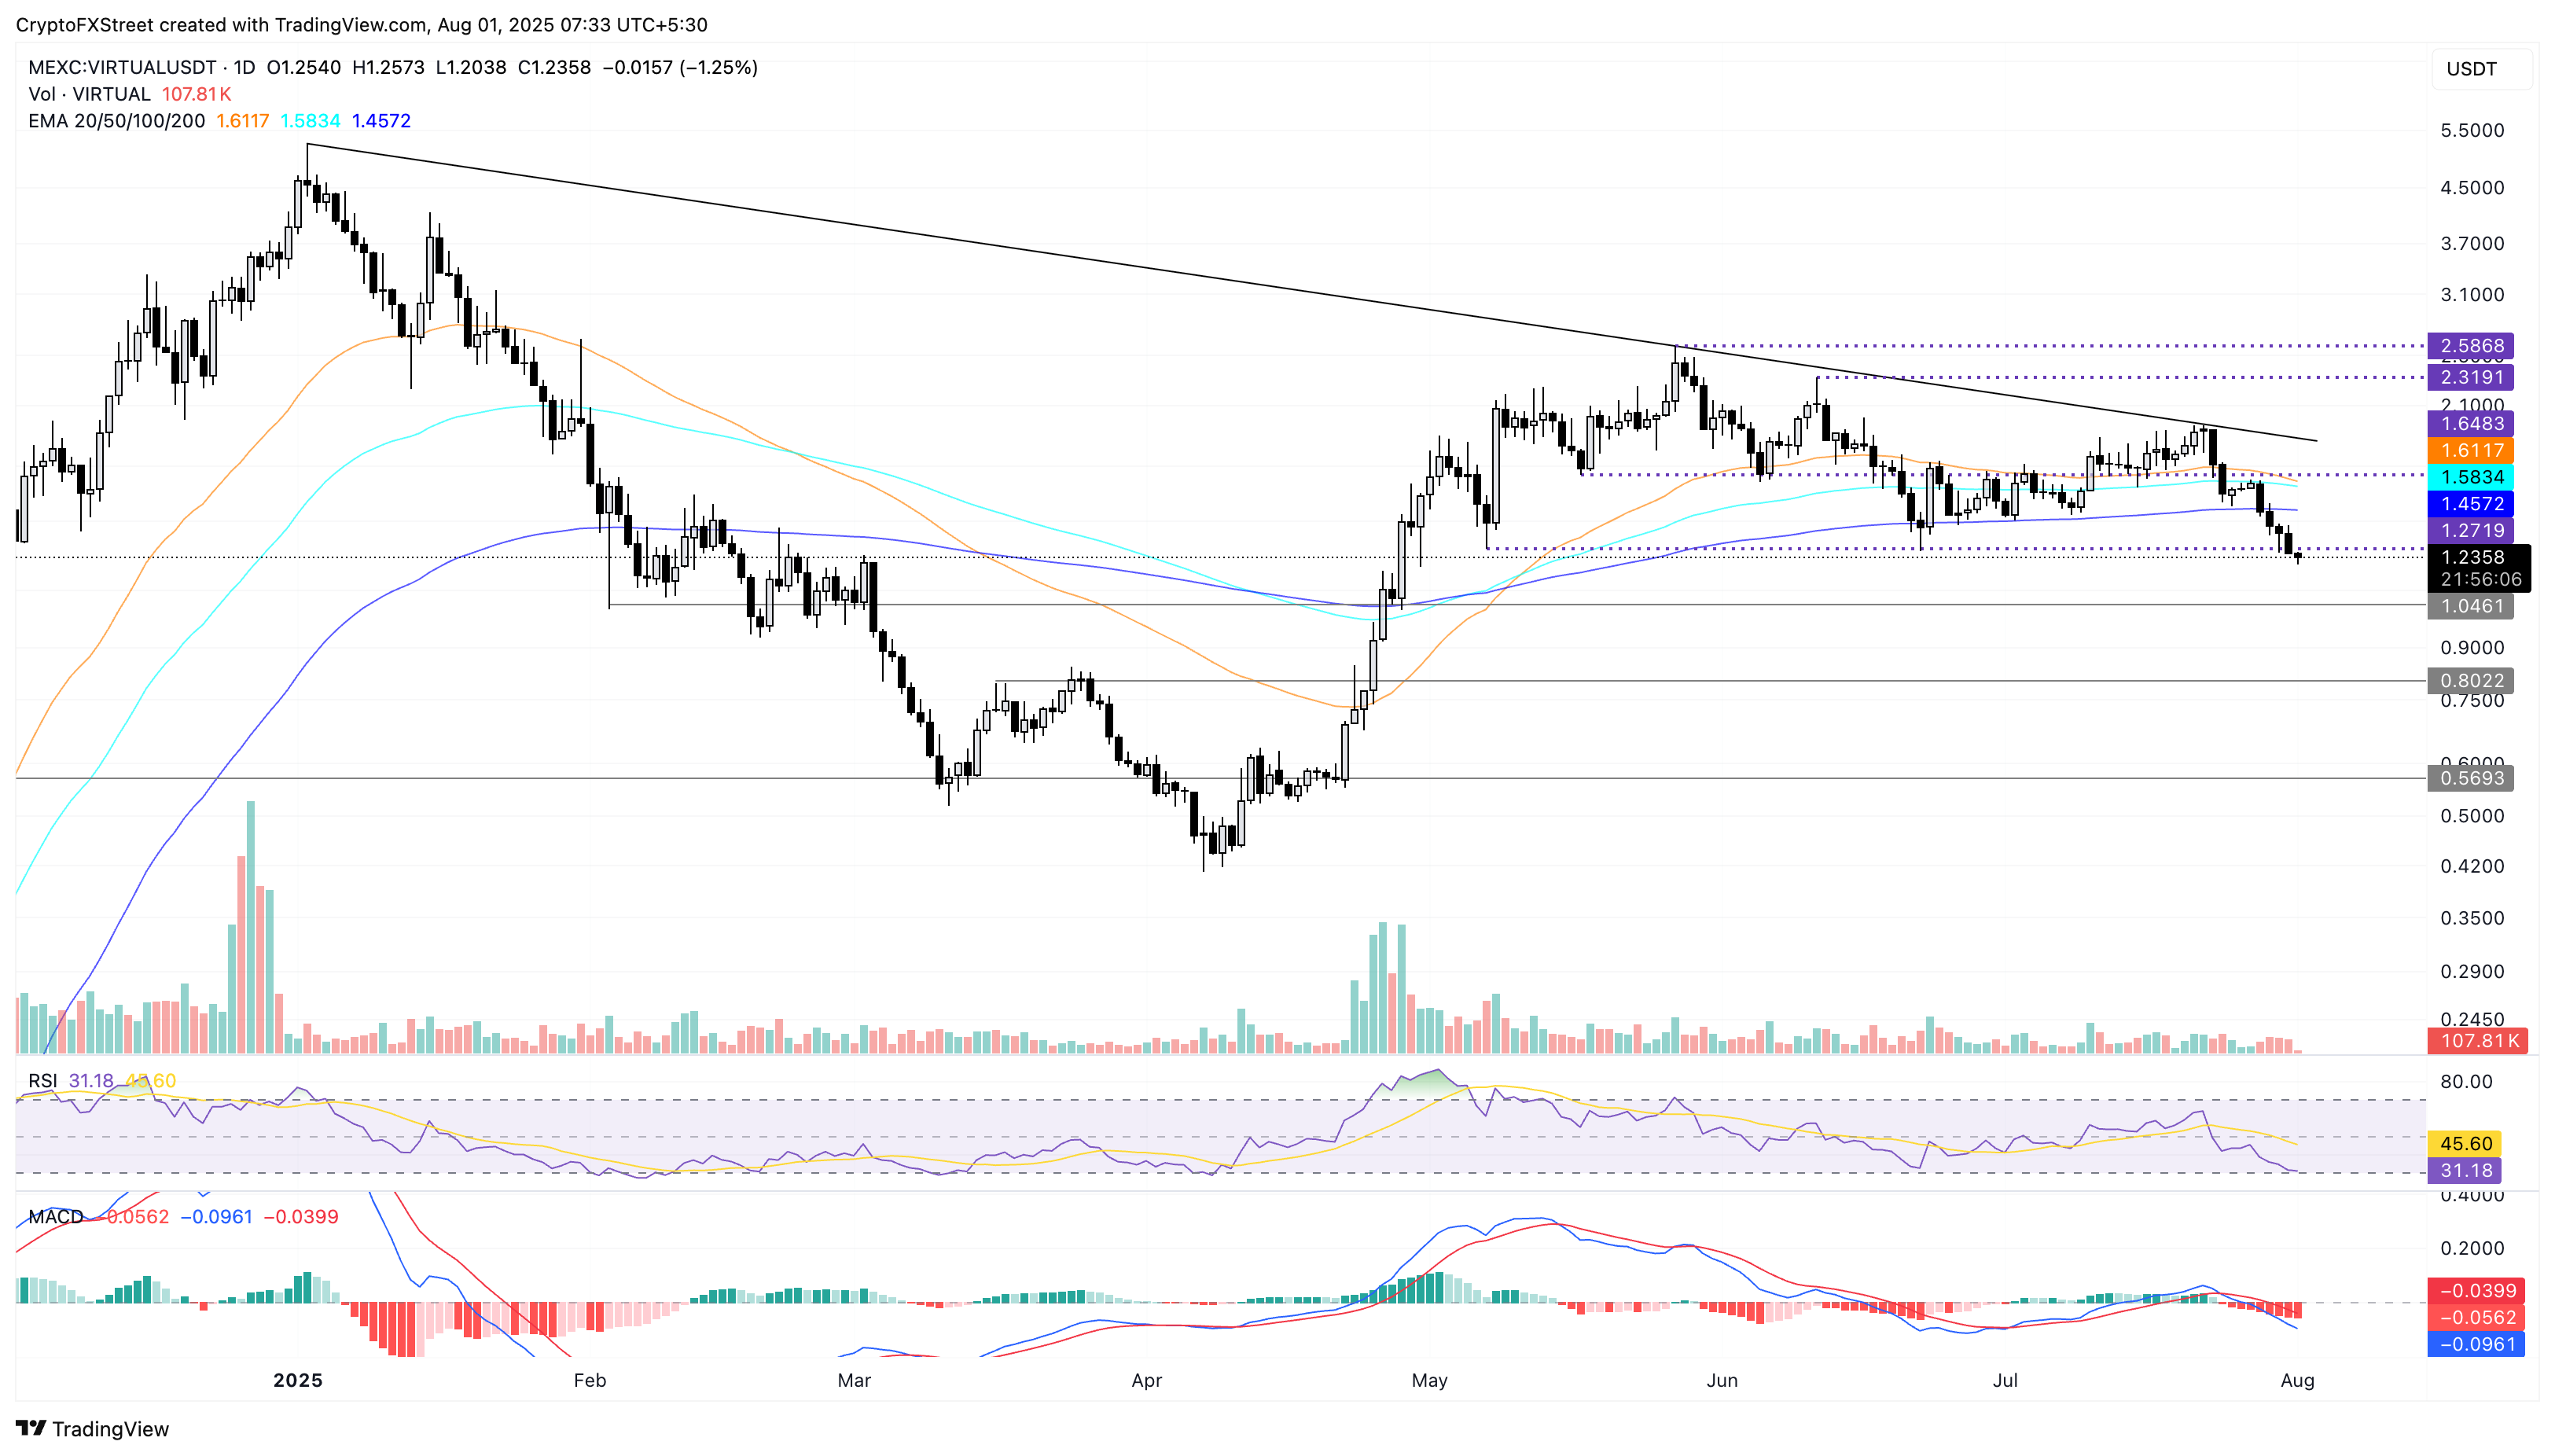
VIRTUAL/USDT daily price chart.
If VIRTUAL resurfaces above the $1.27 support level, it could extend a recovery run to the 200-day EMA at $1.45.
PENDLE struggles below the 50-day EMA
Pendle edges lower by over 1% at press time to trade at $3.98. The downfall has crossed below the 50-day EMA at $4.05, underpinned by the MACD indicator, which flashed a sell signal on Tuesday.
Investors may consider the advancing trend, indicated by the red histogram bars, as a sign of increasing bearish momentum. Furthermore, the RSI drops below its halfway line to 44, pointing to a steep decline in buying pressure.
The 200-day EMA at $3.82 remains a strong dynamic support for PENDLE. Sellers could consider a decisive close below this support as an entry opportunity, with targets set at $3.59 support level.
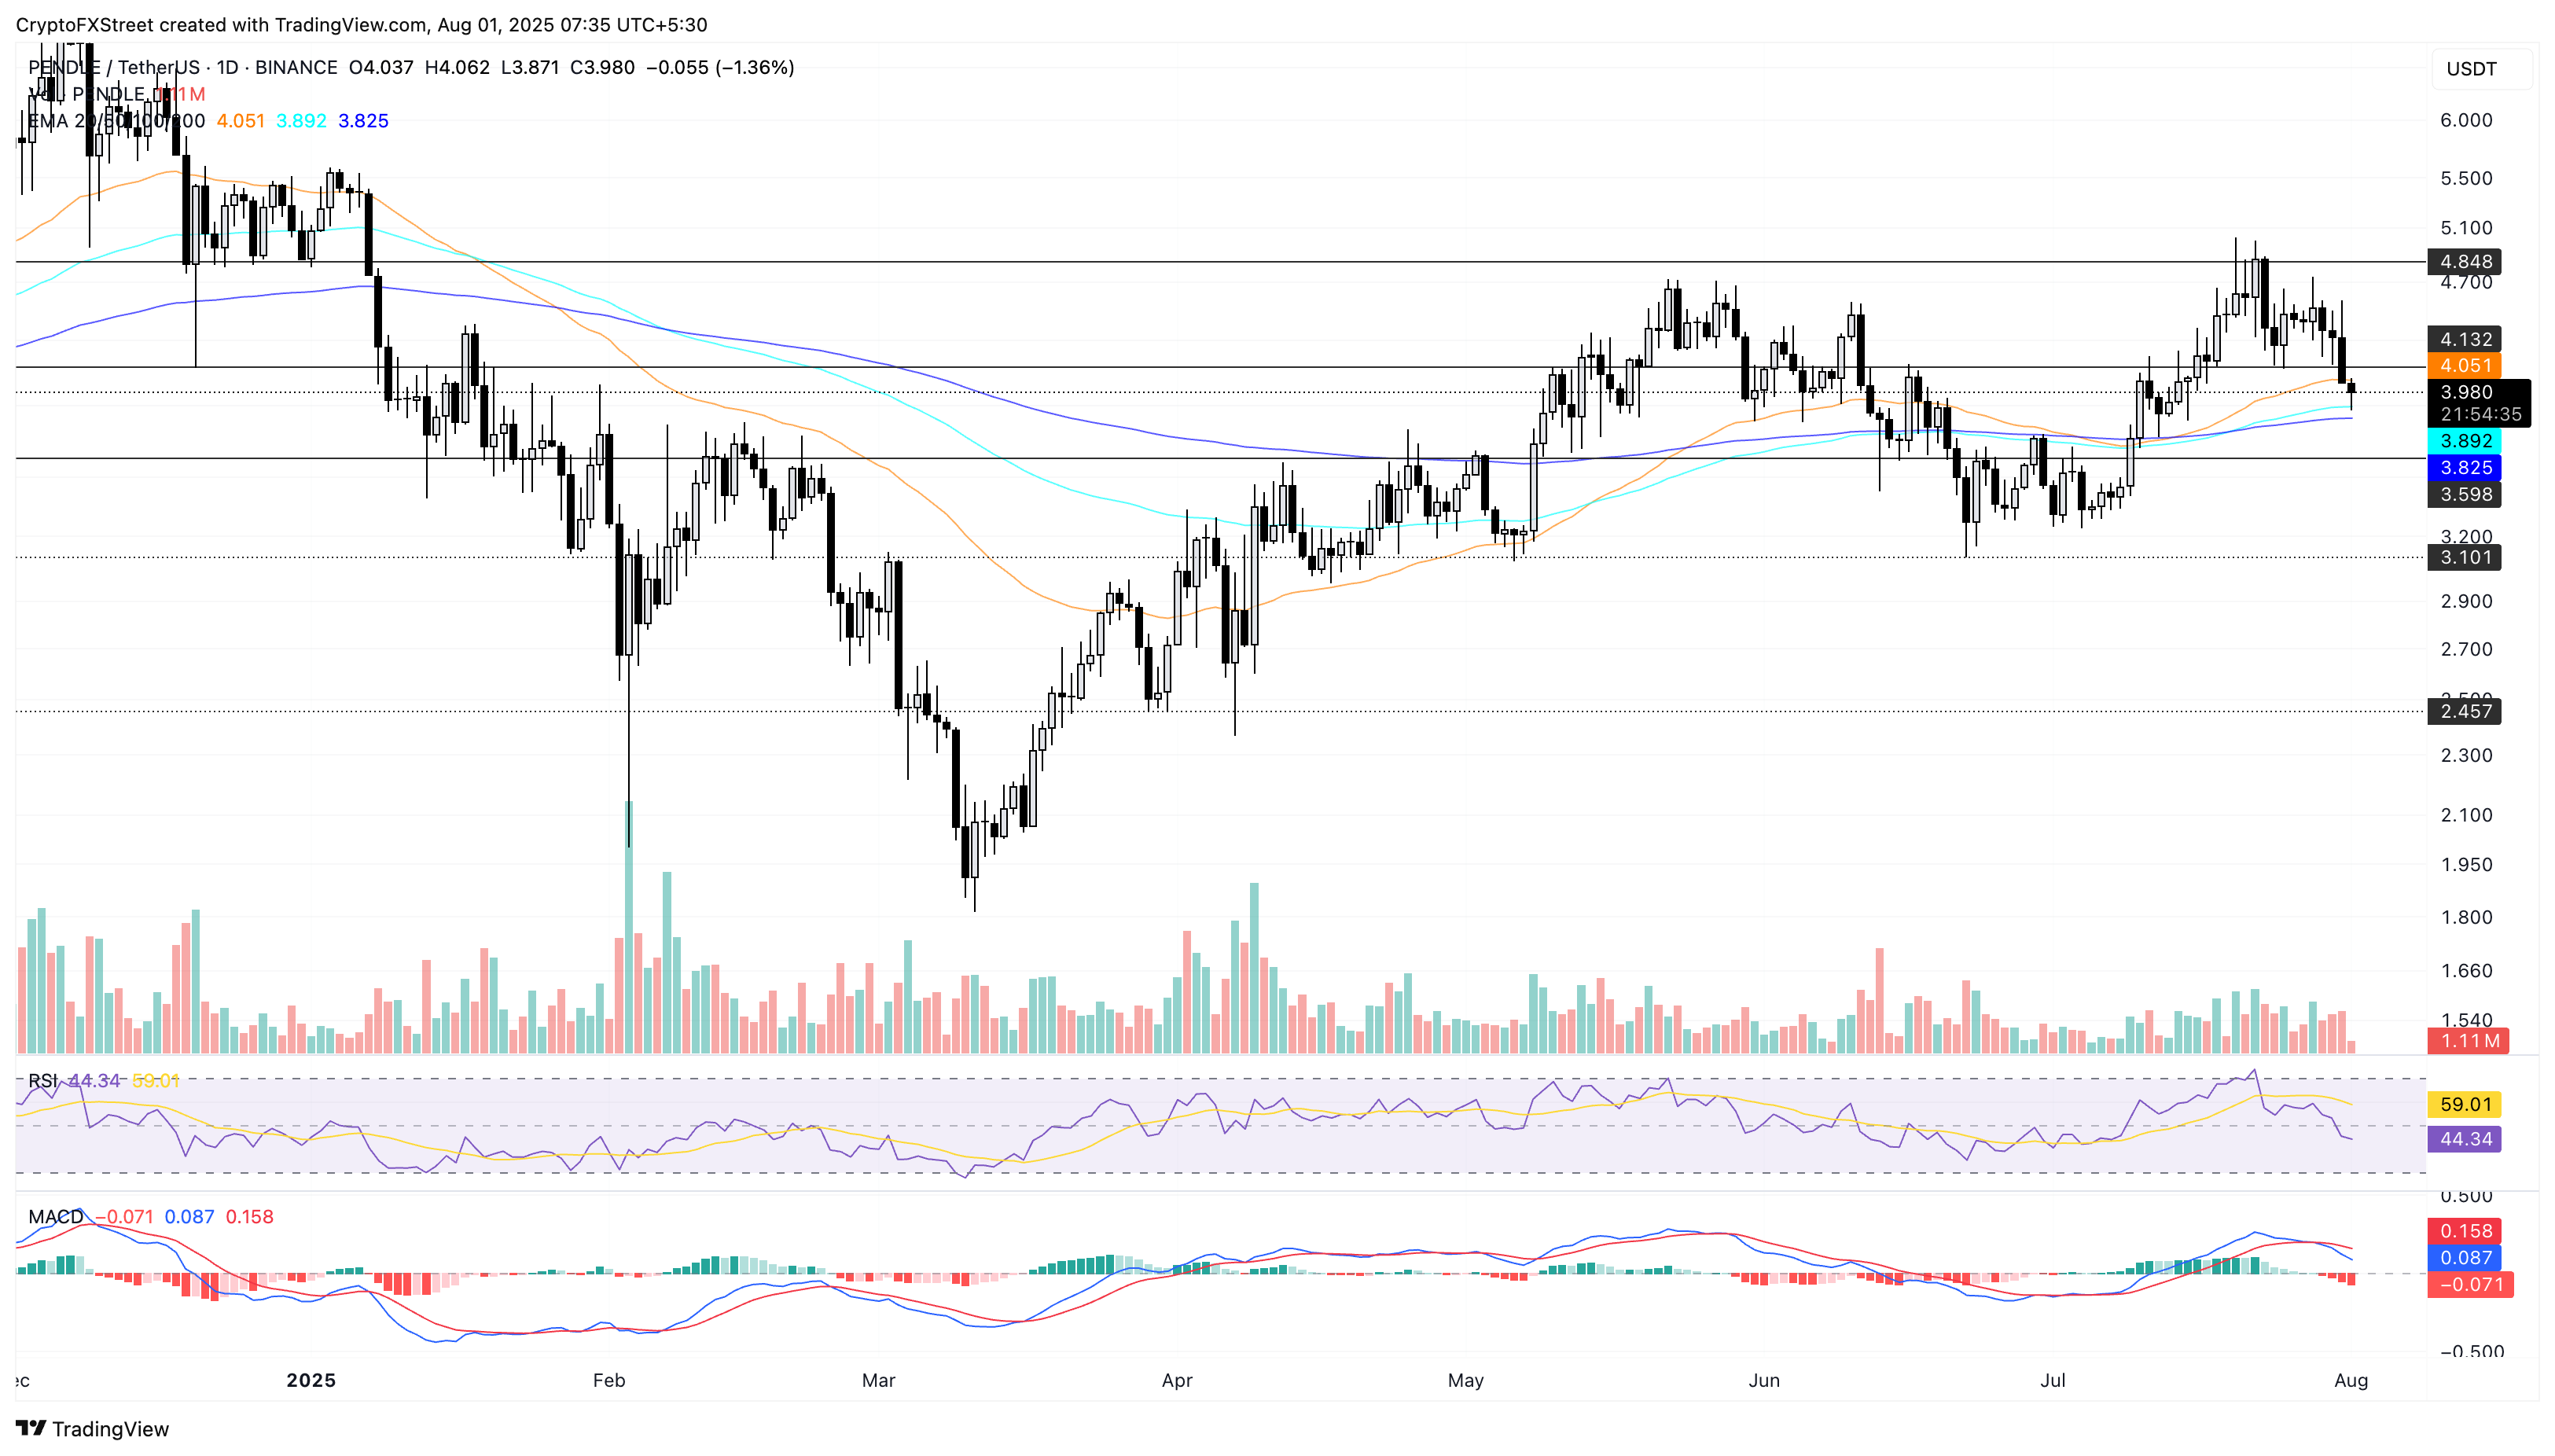
PENDLE/USDT daily price chart.
On the other hand, a reversal of the PENDLE token above the $4.13 level, last tested on Wednesday, could extend the rally to the weekly high of $4.73.

Log in to Reply
Log in to comment your thoughtsComments
Related Articles
|Square
Get the BTCC app to start your crypto journey
Get started today Scan to join our 100M+ users