🚨 Crypto Alert: Bitcoin Eyes $112K, Ethereum Targets $3,500, XRP Aims for $2.78 – Bears on the Prowl!

Crypto markets brace for impact as bearish signals flash red across major assets. Here's where the smart money expects Bitcoin, Ethereum, and Ripple to land.
Bitcoin: The $112K Make-or-Break
BTC's chart paints a grim picture—if support cracks, we're staring down a barrel toward six figures. Institutional whales aren't selling though... yet.
Ethereum: $3,500 or Bust
ETH's DeFi dominance isn't saving it from macro pressures. Gas fees could fund a small country, but that won't matter if ETH can't hold this key level.
XRP: The $2.78 Gamble
Ripple's legal wins mean squat against market tides. Retail's favorite 'cheap coin' needs to prove it's more than just lawsuit headlines.
Meanwhile, traditional finance bros still think 'blockchain' is a new type of Peloton bike. The more things change...
Bitcoin is set for correction below 16-day range
Bitcoin price finally broke below its lower consolidation level at $116,000 on Thursday, ending a 16-day consolidation phase and signaling a potential shift in market momentum. At the time of writing on Friday, it hovers at around $115,800.
If BTC continues its pullback, it could extend the decline to retest the 50-day Exponential Moving Average (EMA) at $112,961.
The Relative Strength Index (RSI) on the daily chart is slipping below its neutral level of 50 and points downward, indicating that bearish momentum is gaining traction. The Moving Average Convergence Divergence (MACD) showed a bearish crossover on July 23, giving sell signals. It also shows a rising red histogram bar below its neutral line, suggesting further bearish momentum and a downward trend.
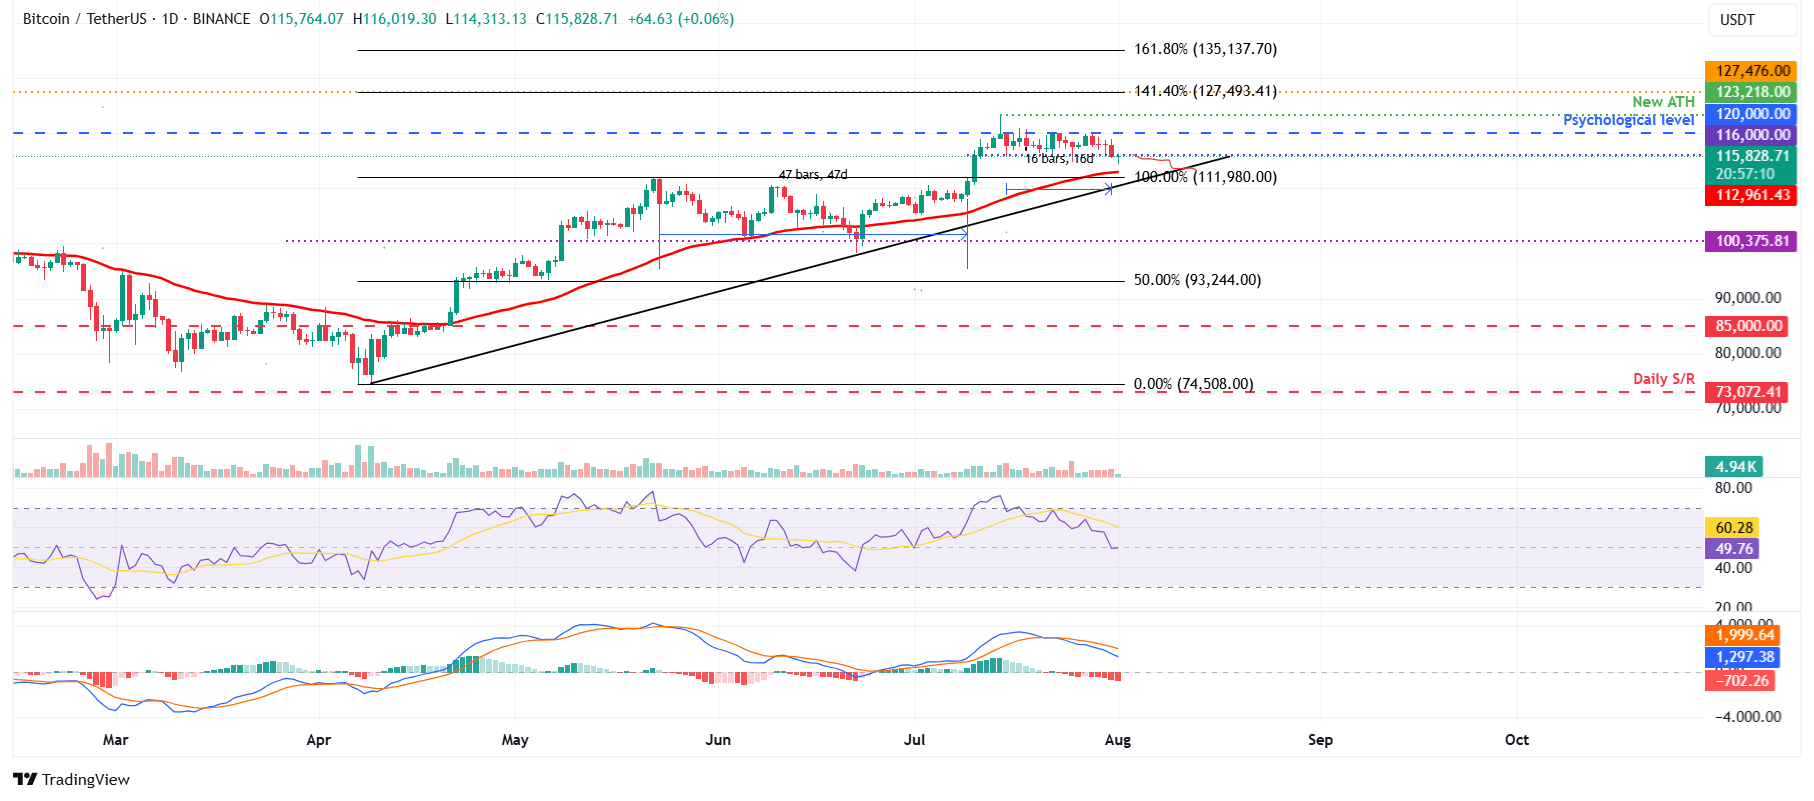
BTC/USDT daily chart
However, if BTC recovers, it could extend the recovery toward its upper boundary of the consolidation range at $120,000.
Ethereum bears aiming for $3,500 mark
Ethereum price declined nearly 3% on Thursday, closing below its daily support level of $3,730. At the time of writing on Friday, it hovers at around $3,700.
If ETH continues its pullback, it could extend the decline to the next support at $3,500.
The RSI momentum indicator on the daily chart slips below its overbought level and points downward, indicating fading bullish momentum. The MACD indicator on the daily chart also showed a bearish crossover on Wednesday, further supporting the bearish thesis and downward trend on the horizon.
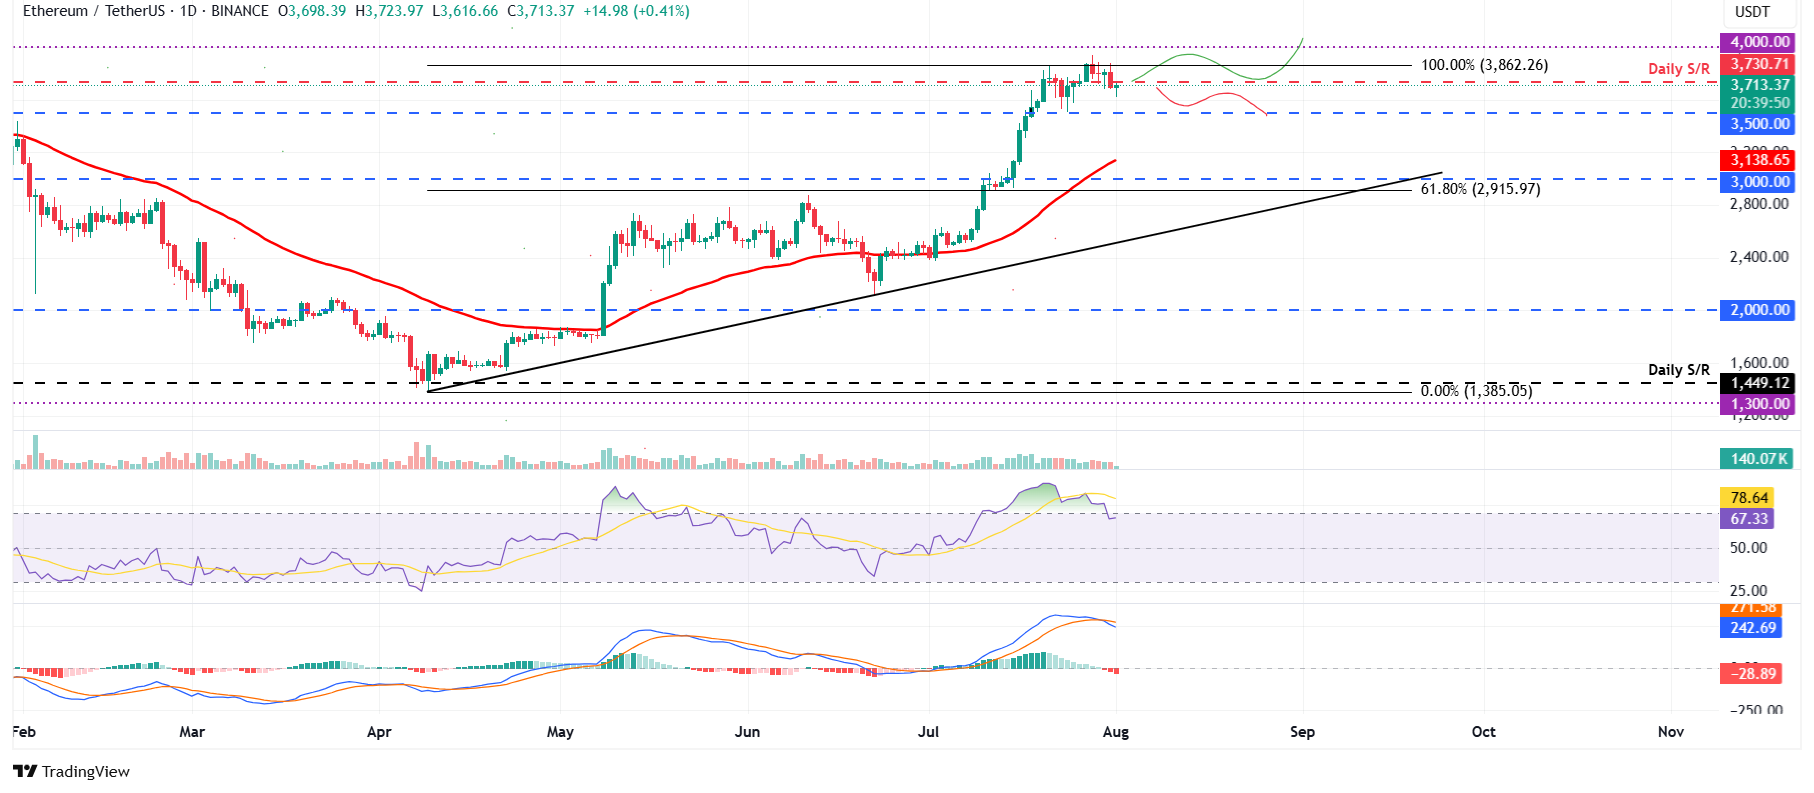
ETH/USDT daily chart
On the other hand, if ETH recovers, it could extend the recovery toward its key psychological level at $4,000.
XRP could decline if it closes below $2.99 support level
XRP price broke below the daily support level at $3.40 on July 23 and declined by 11% the following day. However, it retested and found support around its 61.8% Fibonacci retracement at $2.99 on Friday, rebounding 3.43% during the weekend. At the start of the week on Monday, XRP continued its correction and declined 6.43% until Thursday. At the time of writing, it hovers around $3, finding support around $2.99 level.
If XRP closes below $2.99, it could extend the decline toward its next daily support level at $2.72.
Like Bitcoin, XRP’s RSI is showing signs of fading bearish momentum, and the MACD indicator is also supporting the bearish thesis, suggesting a correction ahead.
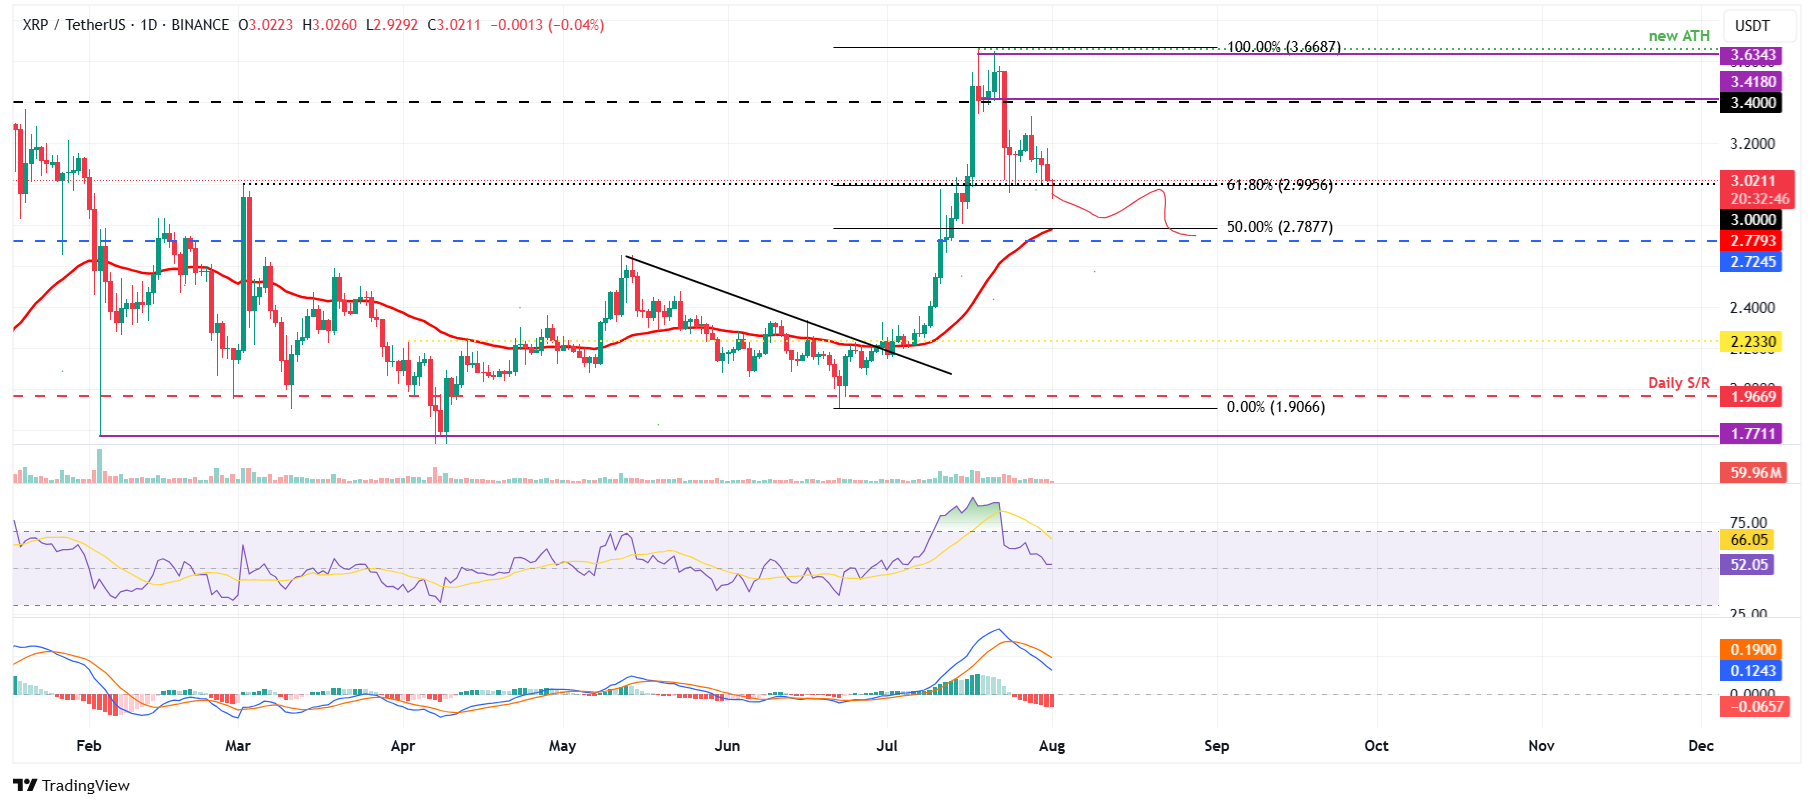
XRP/USDT daily chart
Conversely, if the support at $2.99 remains strong, XRP could continue its recovery toward its previous broken support at $3.40.
Cryptocurrency metrics FAQs
What is circulating supply?
The developer or creator of each cryptocurrency decides on the total number of tokens that can be minted or issued. Only a certain number of these assets can be minted by mining, staking or other mechanisms. This is defined by the algorithm of the underlying blockchain technology. On the other hand, circulating supply can also be decreased via actions such as burning tokens, or mistakenly sending assets to addresses of other incompatible blockchains.
What is market capitalization?
Market capitalization is the result of multiplying the circulating supply of a certain asset by the asset’s current market value.
What is trading volume?
Trading volume refers to the total number of tokens for a specific asset that has been transacted or exchanged between buyers and sellers within set trading hours, for example, 24 hours. It is used to gauge market sentiment, this metric combines all volumes on centralized exchanges and decentralized exchanges. Increasing trading volume often denotes the demand for a certain asset as more people are buying and selling the cryptocurrency.
What is the funding rate?
Funding rates are a concept designed to encourage traders to take positions and ensure perpetual contract prices match spot markets. It defines a mechanism by exchanges to ensure that future prices and index prices periodic payments regularly converge. When the funding rate is positive, the price of the perpetual contract is higher than the mark price. This means traders who are bullish and have opened long positions pay traders who are in short positions. On the other hand, a negative funding rate means perpetual prices are below the mark price, and hence traders with short positions pay traders who have opened long positions.

Log in to Reply
Log in to comment your thoughtsComments
Related Articles
|Square
Get the BTCC app to start your crypto journey
Get started today Scan to join our 100M+ users