SUI Price Poised for Breakout as TVL and Open Interest Smash Records

Move over, legacy chains—SUI's defi ecosystem is flexing hard. With total value locked and derivatives interest hitting all-time highs, traders are piling in ahead of what could be a major price surge.
The Layer 1 chain's metrics scream bullish: TVL growth outpacing 90% of competitors while open interest positions suggest institutional money is finally waking up to SUI's potential. Not bad for a chain Wall Street analysts wrote off as 'just another altcoin' six months ago.
Technical indicators show the rally has room to run. The only thing climbing faster than SUI's price? The number of VC-backed projects suddenly rebranding as 'SUI-native infrastructure'.
SUI TVL records a new all-time high of $2.28 billion
DeFiLlama data shows that the TVL on the SUI network has reached a record high of $2.28 billion, up from $2.19 billion last week. A $90 million increase reflects a rising influx of users on the network willing to trade, stake, or avail other decentralized finance (DeFi) services on the network.
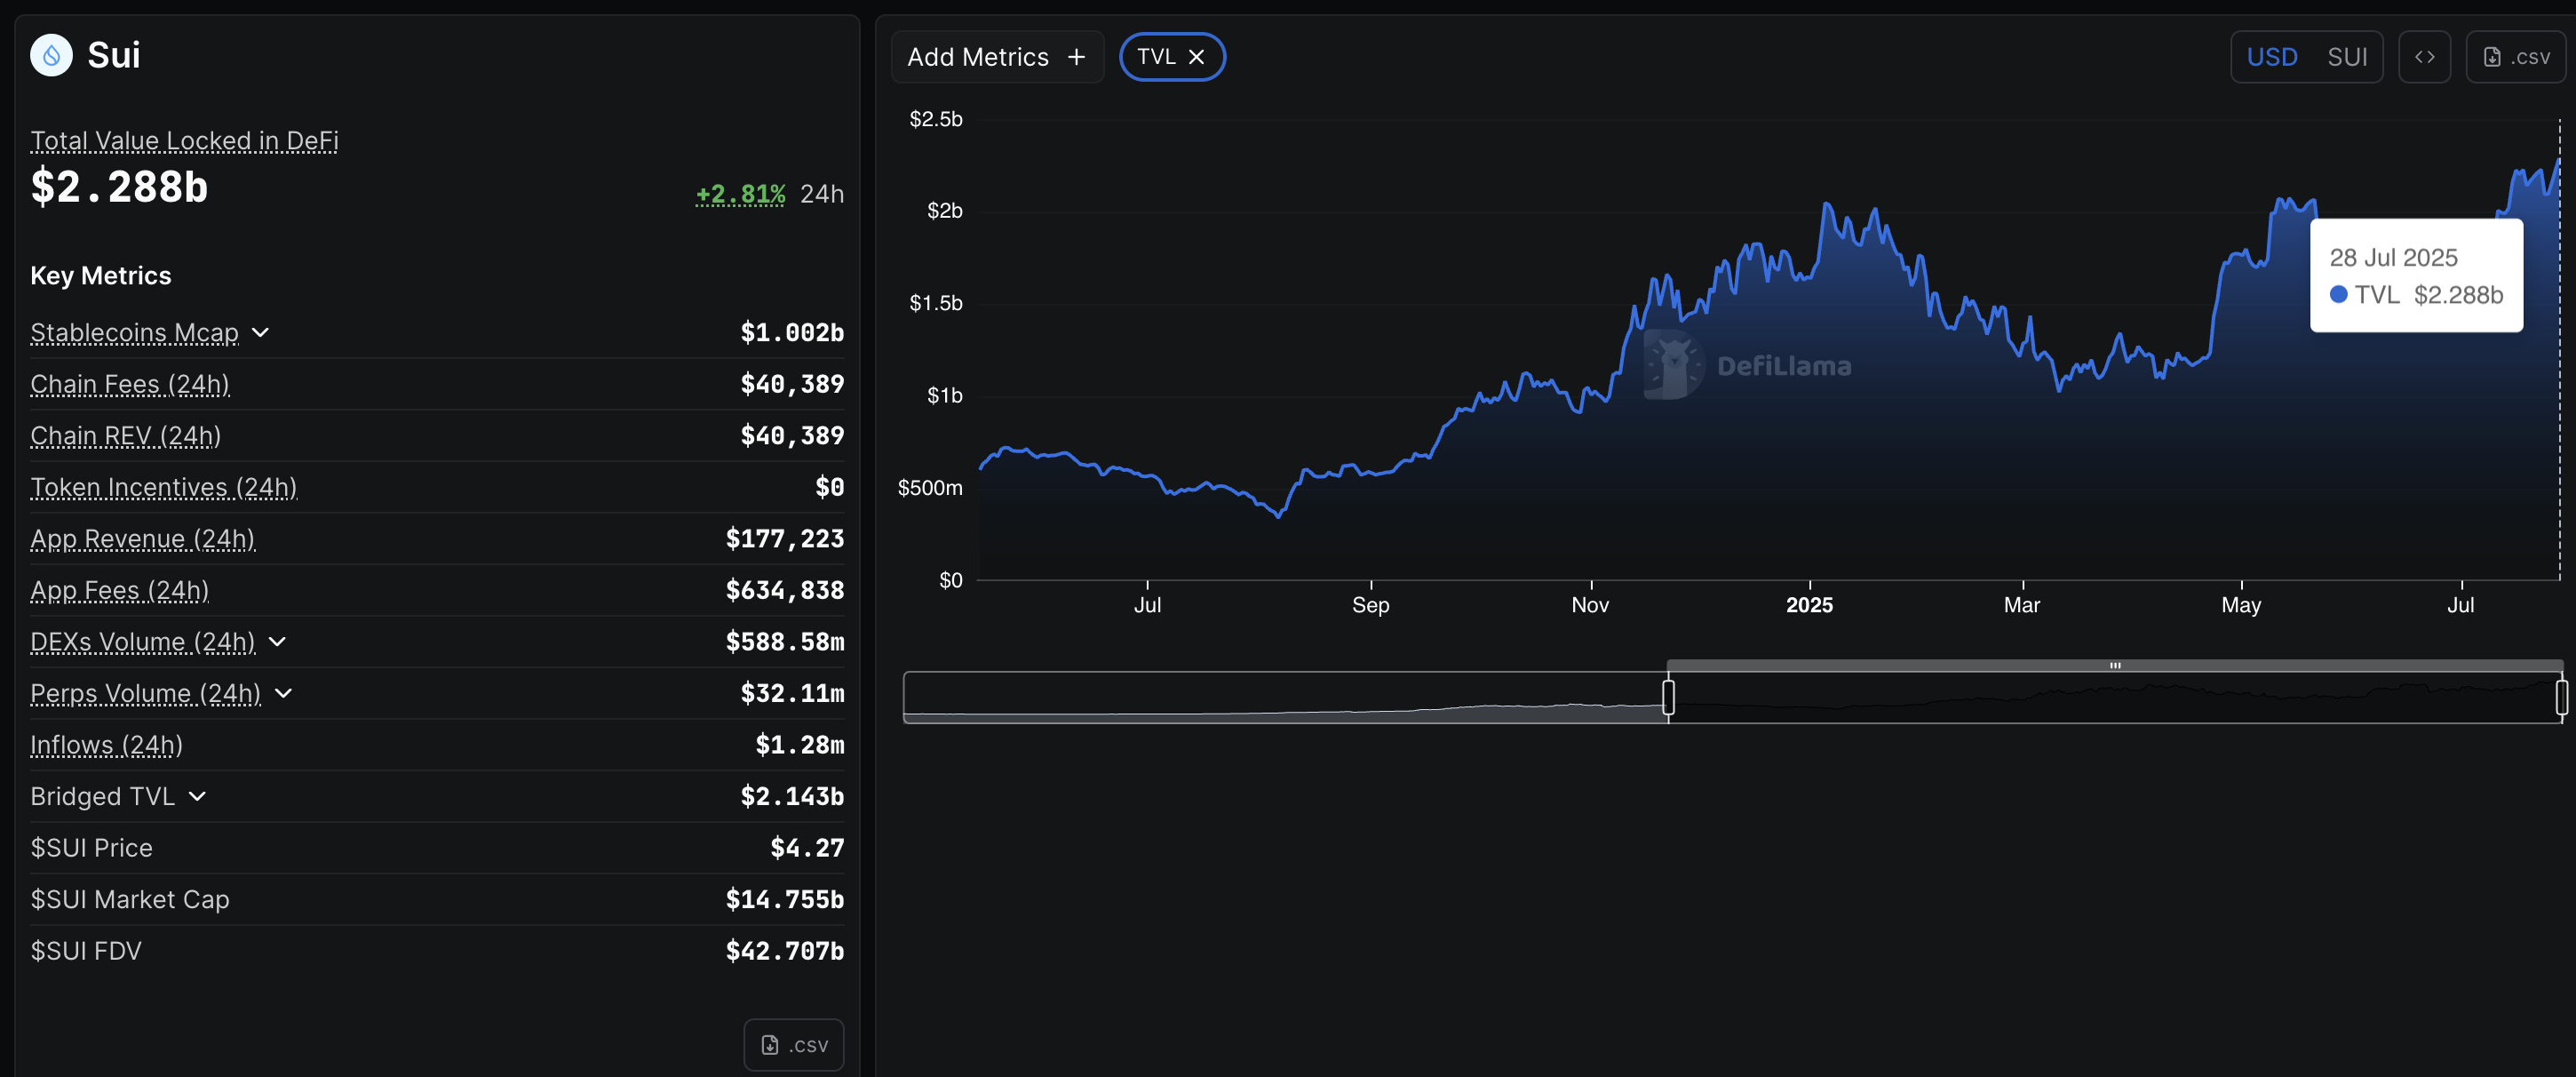
SUI TVL. Source: DeFiLlama
It is worth noting that the Stablecoin market capitalization on the network has crossed $1 billion, indicating increased liquidity.
Open Interest hits record high of $2.66 billion
Coinglass’s data displays the SUI Open Interest (OI) rising to $2.66 billion, up from $2.36 billion on Sunday. The $30 billion surge in the last 24 hours indicates a significant capital inflow, likely driven by rising interest among traders.
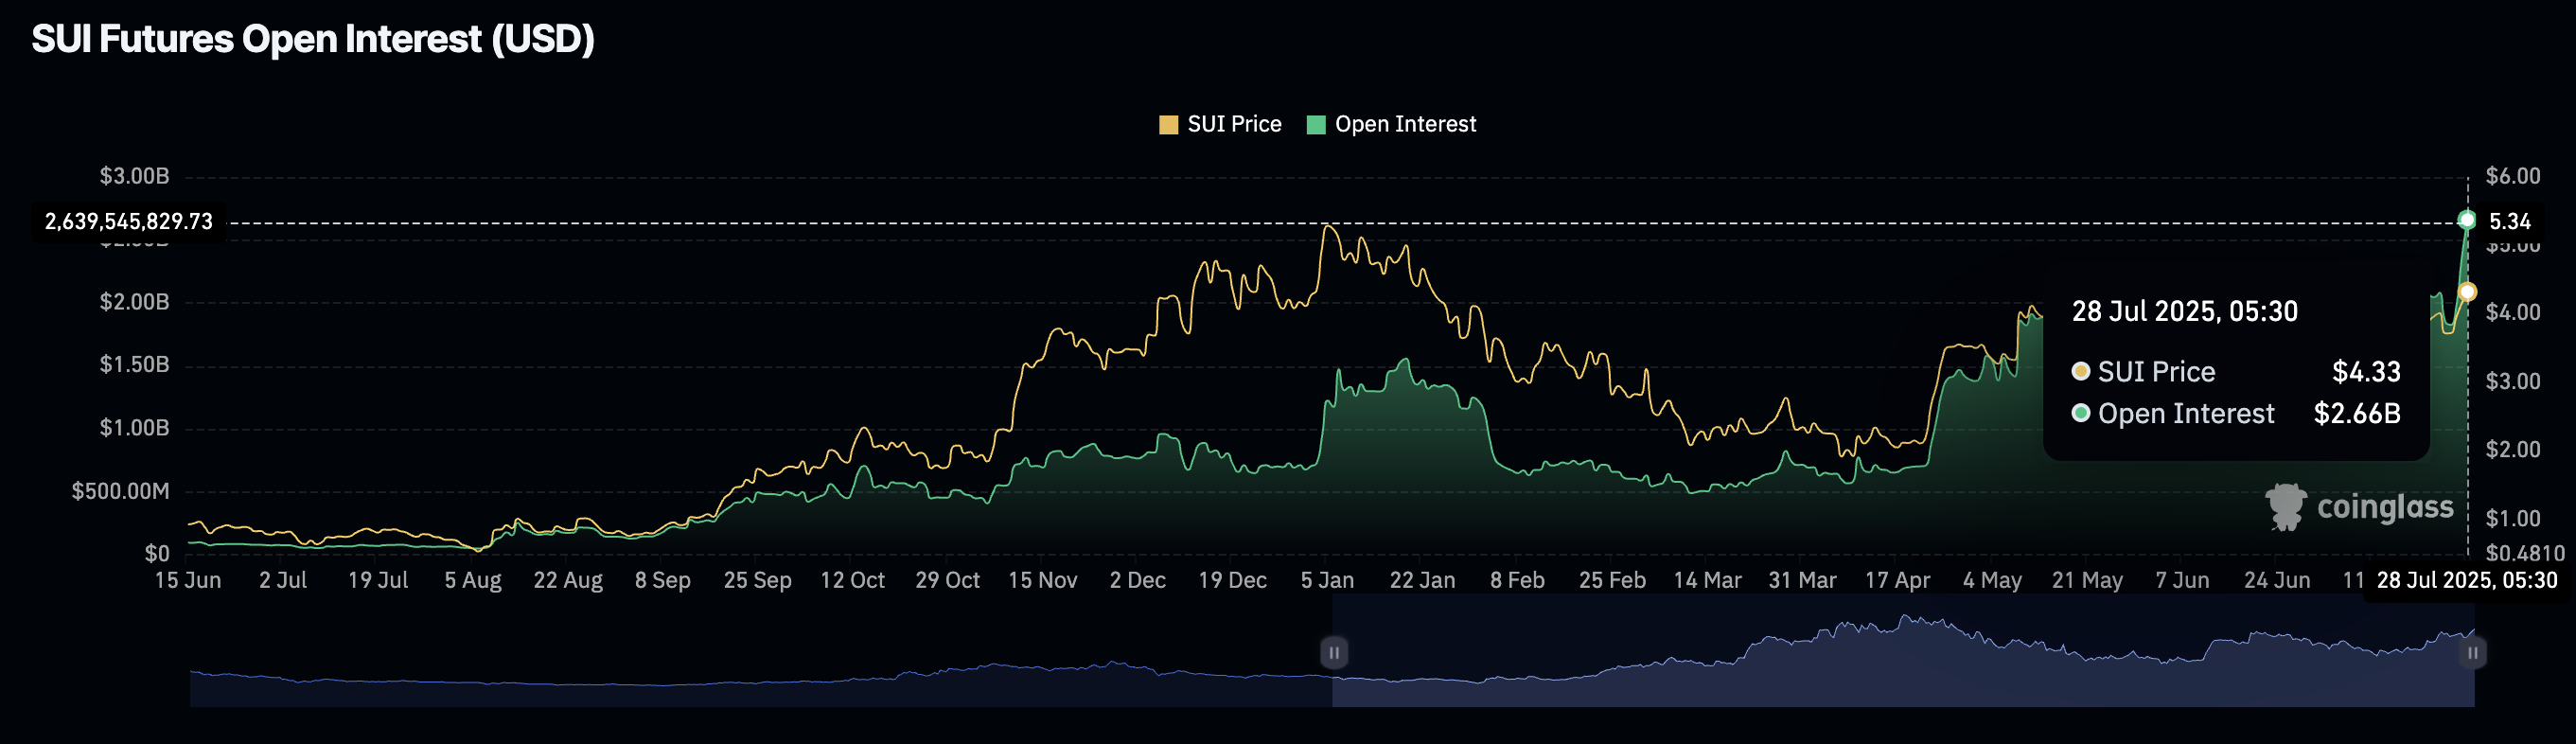
SUI Open Interest. Source: Coinglass
The OI-weighted funding rate stands at 0.0198%, up from 0.0129% on Sunday, indicating a greater boost in buying activity with the increased capital inflows. Typically, a spike in funding rate represents a surge in buying pressure as bulls pay the positive rates to keep the swap and spot prices aligned.
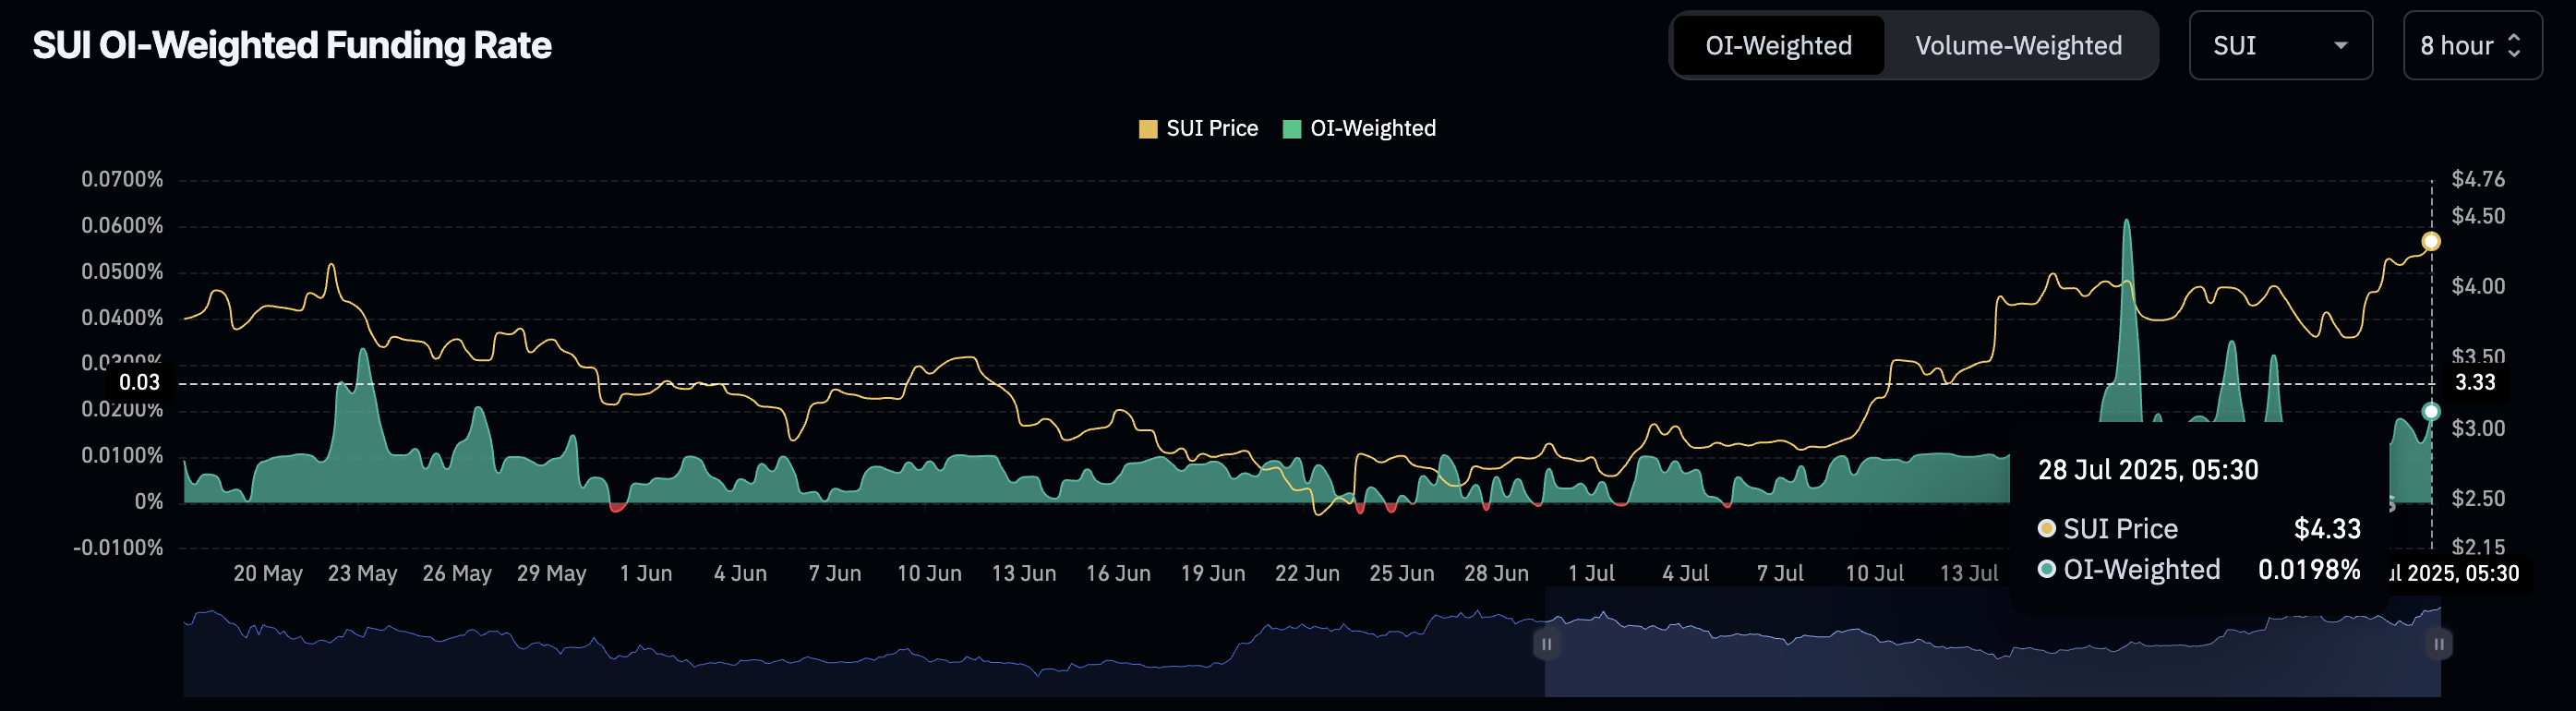
SUI funding rate. Source: Coinglass
SUI faces overhead selling pressure at six-month highs
SUI edges lower by nearly 1% so far on Monday after hitting $4.44 earlier in the day to mark a six-month high. The recent uptrend surpassing $4.29 marks a complete recovery from the Cetus hack in May.
However, the TVL and OI growth surpass the bullish run in spot prices, suggesting the boost in network activity and the derivative market’s Optimism is yet to translate.
The intraday pullback could target the $4.00 round figure for a retest, potentially extending to the 50% Fibonacci retracement at $3.54, drawn from the $5.36 peak on January 6 to the $1.71 low on April 7.
The Relative Strength Index (RSI) reads 65 on the daily chart as it faces downside pressure. Notably, the RSI shifts lower, diverging from the rising sui price trend, which indicates a potential hidden bearish divergence. Investors may want to temper their bullish expectations, as the said divergence often foreshadows a quick correction.
The Moving Average Convergence Divergence (MACD) bounces off its signal line with a surge in green histogram bars from the zero line, indicating the bulls are battling against a trend reversal.
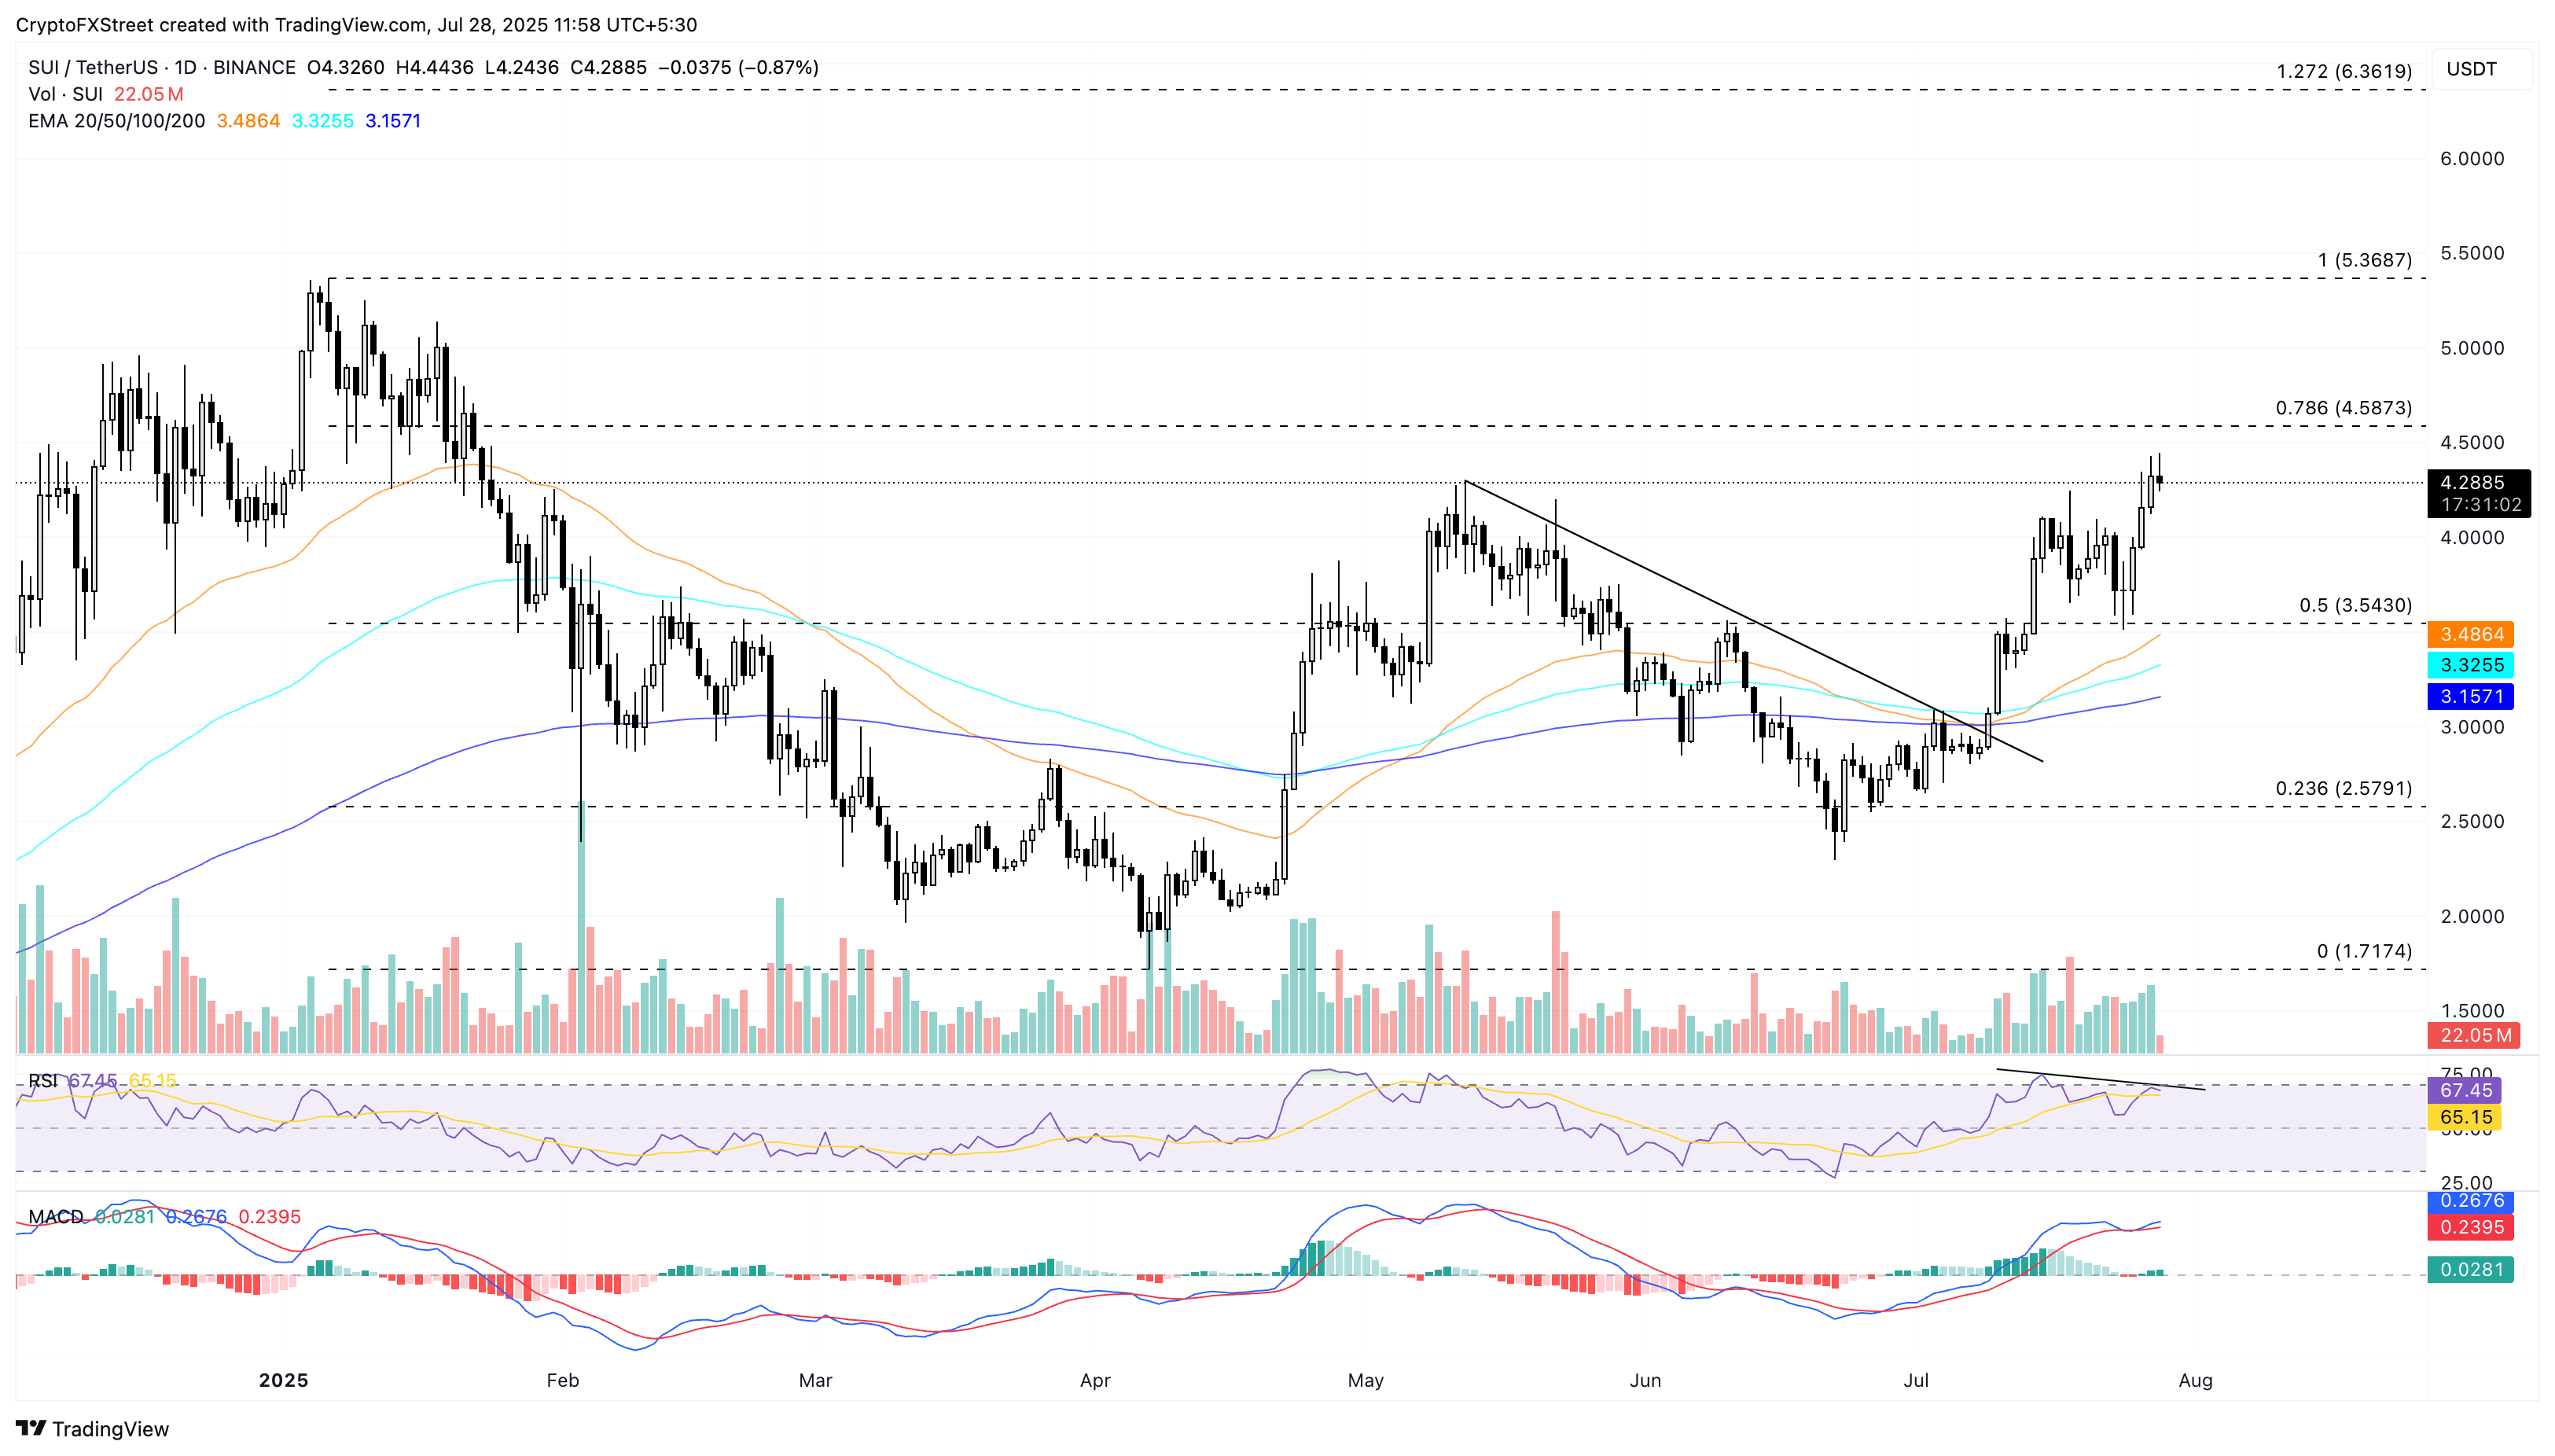
SUI/USDT daily price chart.
If SUI upholds bullish momentum, it could extend the rally to the 78.6% Fibonacci level at $4.58. A potential close above this level WOULD increase the chances of SUI reclaiming the $5 milestone.
