🚀 Maple Finance Soars: Upbit’s SYRUP Listing & Q2 Report Ignite Bullish Rally

Maple Finance just got a double-dose of rocket fuel. Upbit’s surprise SYRUP listing collided with a bullish Q2 report—and traders are scrambling for position.
The SYRUP Effect: Korea’s largest exchange flipping the 'listed' switch sent Maple’s token into a liquidity frenzy. No official numbers yet, but the order books are screaming.
Q2 Numbers That Don’t Suck: Unlike some *cough* stablecoin projects, Maple actually showed revenue growth. Institutional lending volumes up, defaults down—boringly competent, which in DeFi counts as a miracle.
What’s Next? The 50-day MA just got obliterated. If this holds, even the usual 'sell the news' crowd might FOMO in. Just maybe keep an eye on those Korean trading bots—they play for keeps.
SYRUP taps into the Korean market with Upbit listing
Upbit, the Korean cryptocurrency exchange, announced the listing of the SYRUP token on Friday, with trading starting at 06:00 GMT against Bitcoin (BTC), Tether’s USD stablecoin (USDT), and Korean Won stablecoin (KRW). The listing on Upbit catalyzes the slow recovery seen in SYRUP as it taps into the demand of Korean investors.

Maple Finance's Q2 market report, released on Thursday, highlights a 154% surge in quarterly revenue, reaching $2.98 million, and a 200% rise in annual recurring revenue to $15 million, compared to Q1.
Moreover, the largest on-chain asset manager ended Q2 with $2.6 billion in assets under management (AUM), up to $3.18 billion when writing the report. The AUM reflects the growing adoption of the on-chain asset manager, while the increasing revenue suggests rising capital flows.
Notably, the fully diluted valuation of Maple Finance’s SYRUP token reached $710 million as of Friday.
Amid the increased demand, Maple Finance expects to boost the revenues and AUM while planning to increase the revenue allocation to buyback SYRUP tokens to 25% from 20%. Typically, an increase in buybacks WOULD lead to heightened demand in the spot market due to a decrease in available supply.
SYRUP eyes further gains as bullish momentum revives
SYRUP prints its fifth consecutive bullish candle on the daily chart, extending the bounceback rally from the 100-day Exponential Moving Average (EMA) and the $0.40 support floor started on Monday. The intraday surge hits a record of $0.67.
The bullish run aims to surpass the 50% trend-based Fibonacci retracement level at $0.68, drawn between the uptrend from the $0.08 low on April 7 to the $0.65 high on June 25 and the subsequent pullback to $0.40 on Monday.
A potential daily push above this level could extend the rally to the 61.8% Fibonacci level at $0.75.
The Moving Average Convergence Divergence (MACD) crosses above its signal line, accompanied by rising green histograms that MOVE above the zero line, signaling a trend reversal.
The Relative Strength Index (RSI) at 68 on the daily chart indicates heightened buying pressure as it approaches overbought conditions.
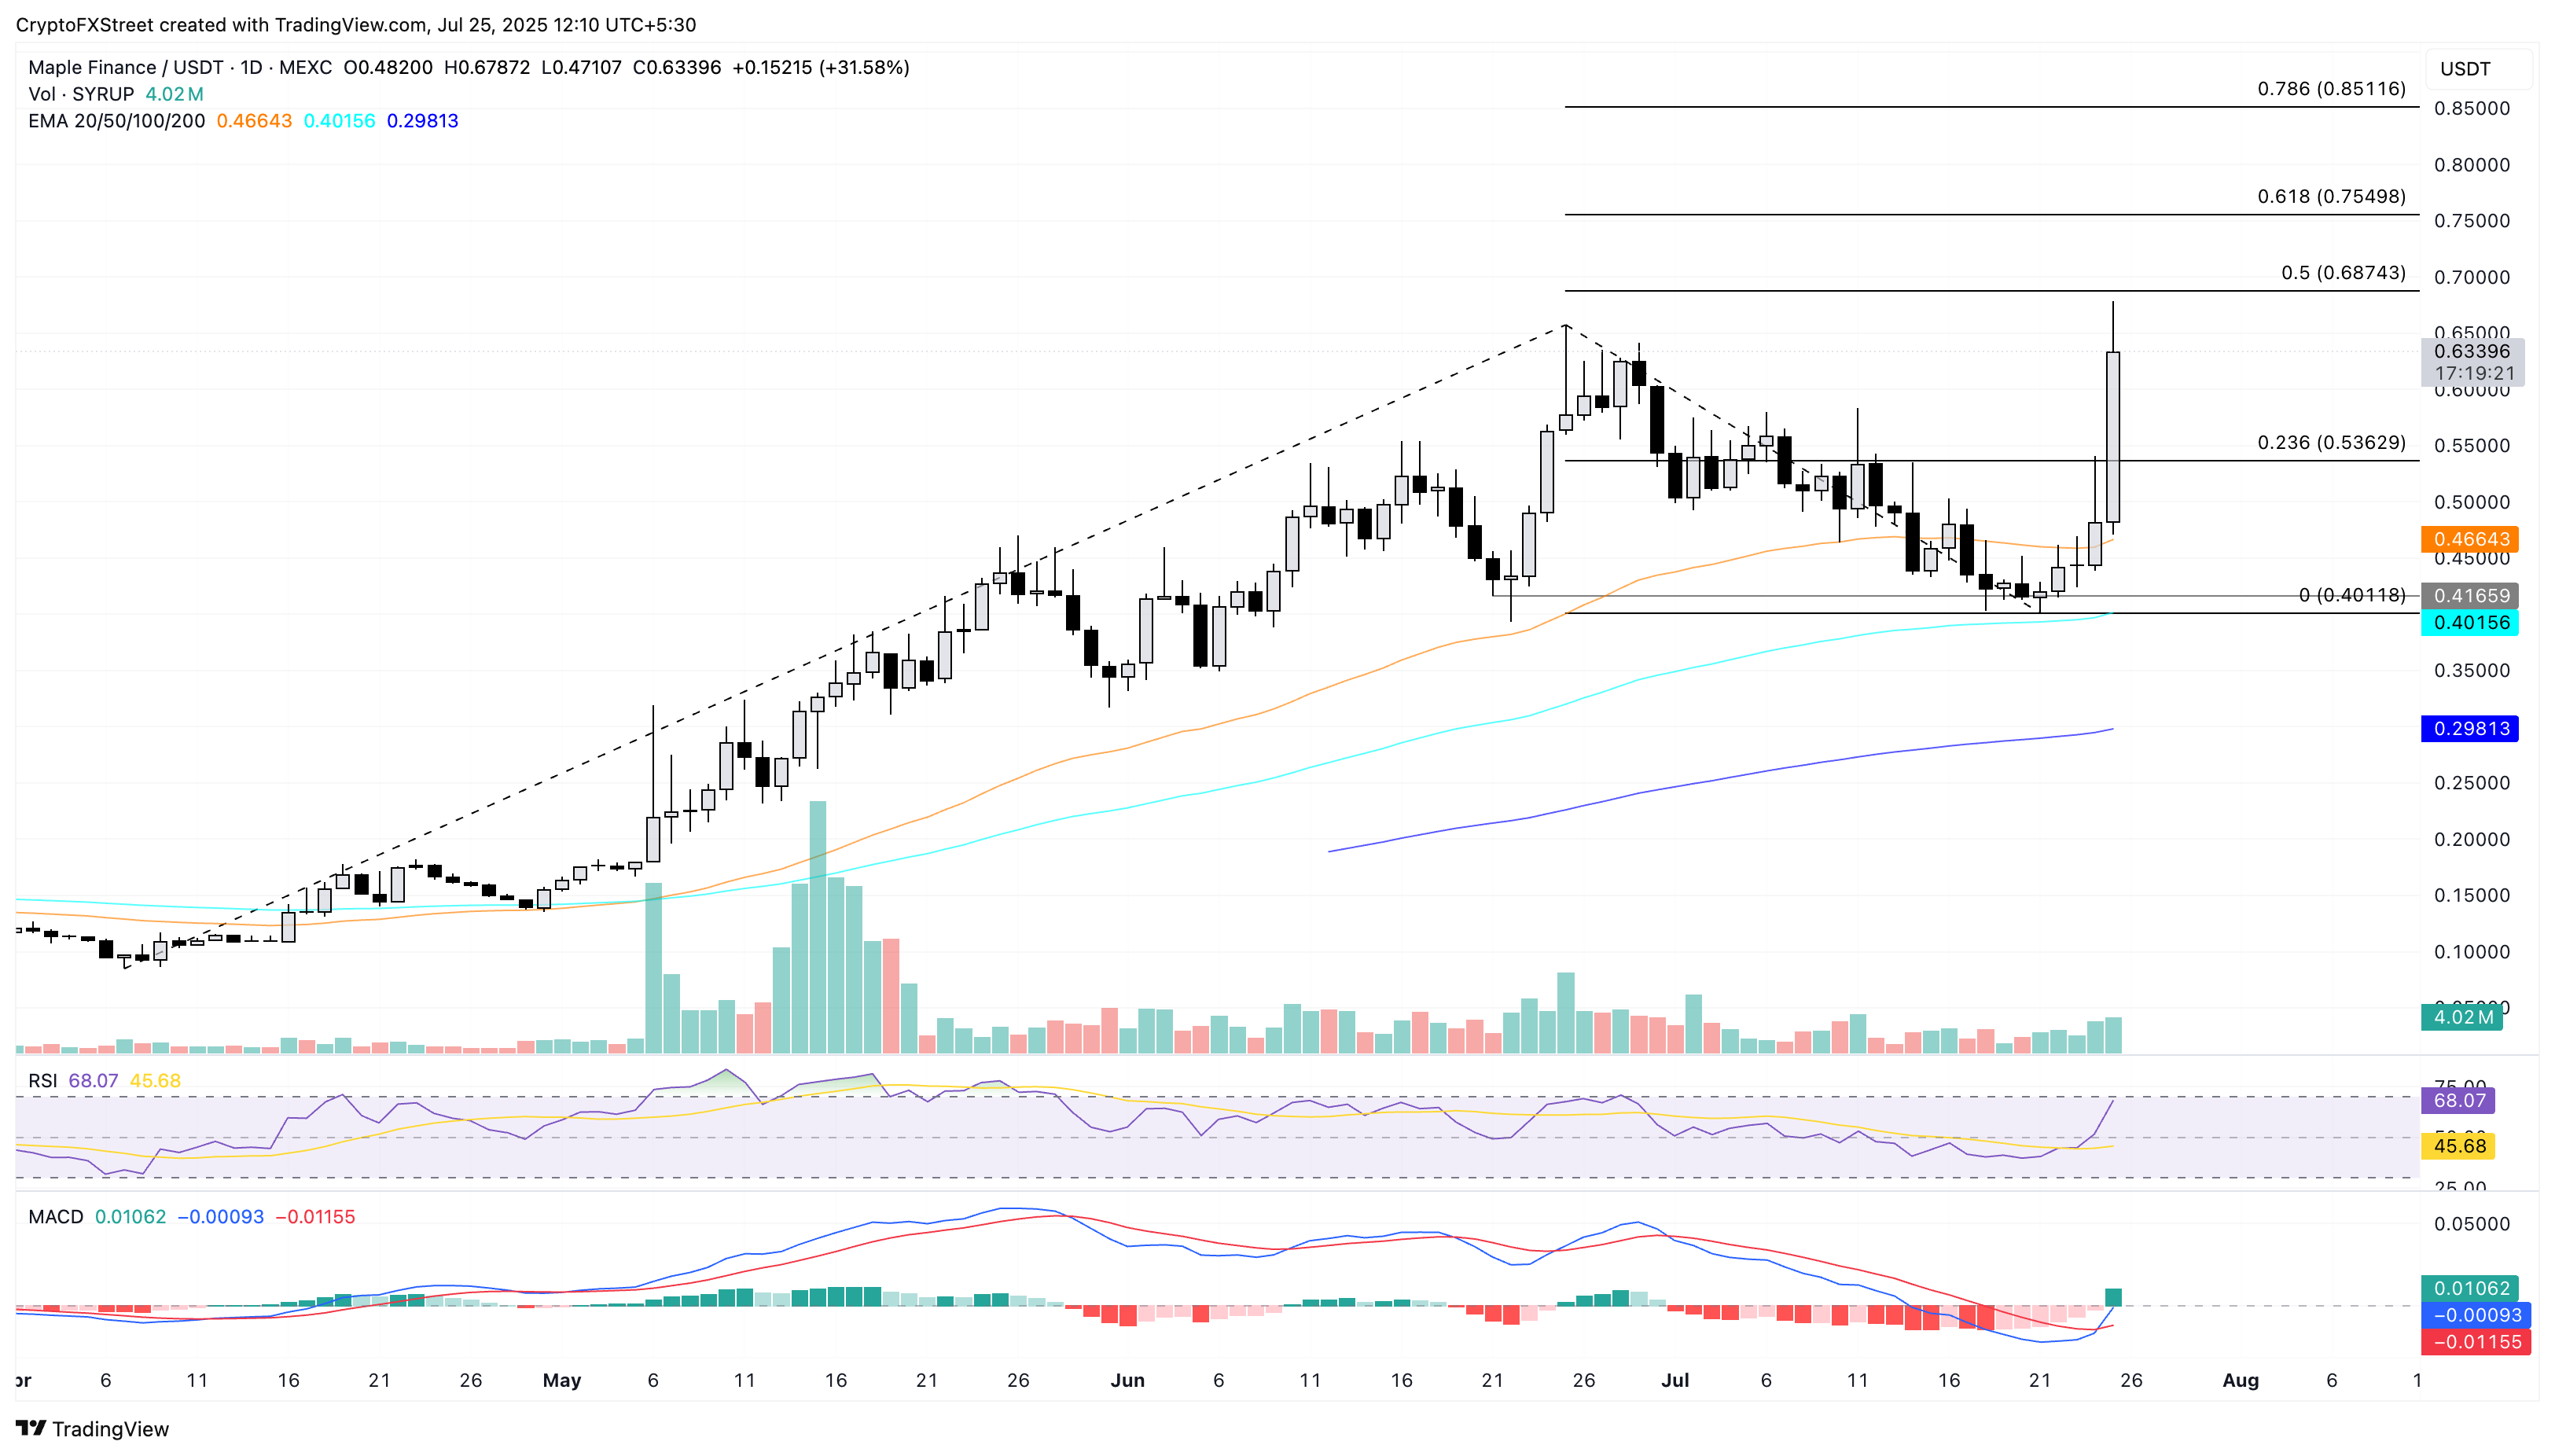
SYRUP/USDT daily price chart.
On the flipside, a reversal from the 50% Fibonacci level at $0.67 could erase the intraday gains to retest the 23.6% Fibonacci level at $0.53.
