🚀 Trump’s AI Boom Ignites These Must-Watch Crypto Tokens – Altcoin Season Is Primed to Explode

Washington just fired the starting pistol. With Trump's surprise executive order fast-tracking US AI dominance, crypto's AI tokens are already surging—and the altcoin pumps are just getting started.
The AI-Crypto Gold Rush Is On
Forget boring ETFs. Traders are piling into AI-linked altcoins as the White House effectively endorses blockchain's role in artificial intelligence infrastructure. Projects blending decentralized compute, data markets, and AI model training are seeing double-digit jumps overnight.
Which Tokens Are Leading the Charge?
Watch for surges in protocols offering:
- Decentralized GPU rentals (because Nvidia's 500% markup needs disruption)
- On-chain AI model marketplaces (where creators actually get paid)
- Blockchain-based data verification (the only way to fight deepfakes)
The Coming Altcoin Supercycle
With Bitcoin dominance dipping below 45%, capital's rotating into small caps at levels not seen since 2021. Meme coins? Sure. But the real smart money's betting on AI infrastructure plays—because nothing gets VCs harder than combining two buzzwords.
Just remember: In crypto, every 'next big thing' eventually crashes. But for now? The AI-alts are printing.
Bittensor recovery stalls as bullish momentum fades
Bittensor edges lower by over 1% at press time on Thursday, extending the 6% loss from Wednesday. Still, the AI crypto holds above the 200-day Exponential Moving Average (EMA) and the $400 psychological level on the daily chart.
TAO tests the 61.8% Fibonacci level at $422, drawn from $748 on December 5 to $167 on April 7. A potential close below this level could extend the decline to the 50-day EMA at $382.
The 50-day EMA marked a Golden Cross pattern with the 200-day EMA on Sunday, signaling a buy signal for sidelined investors as the short-term trend outpaces the longer-term motion.
Still, the Moving Average Convergence Divergence (MACD) indicator displays a declining trend in the histogram bars. A rise of the red histogram bar below the zero line WOULD flash a reversal sign in Bittensor.
The Relative Strength Index (RSI) reads 57 on the daily chart as it reverses from NEAR the overbought zone, suggesting a decrease in buying pressure.
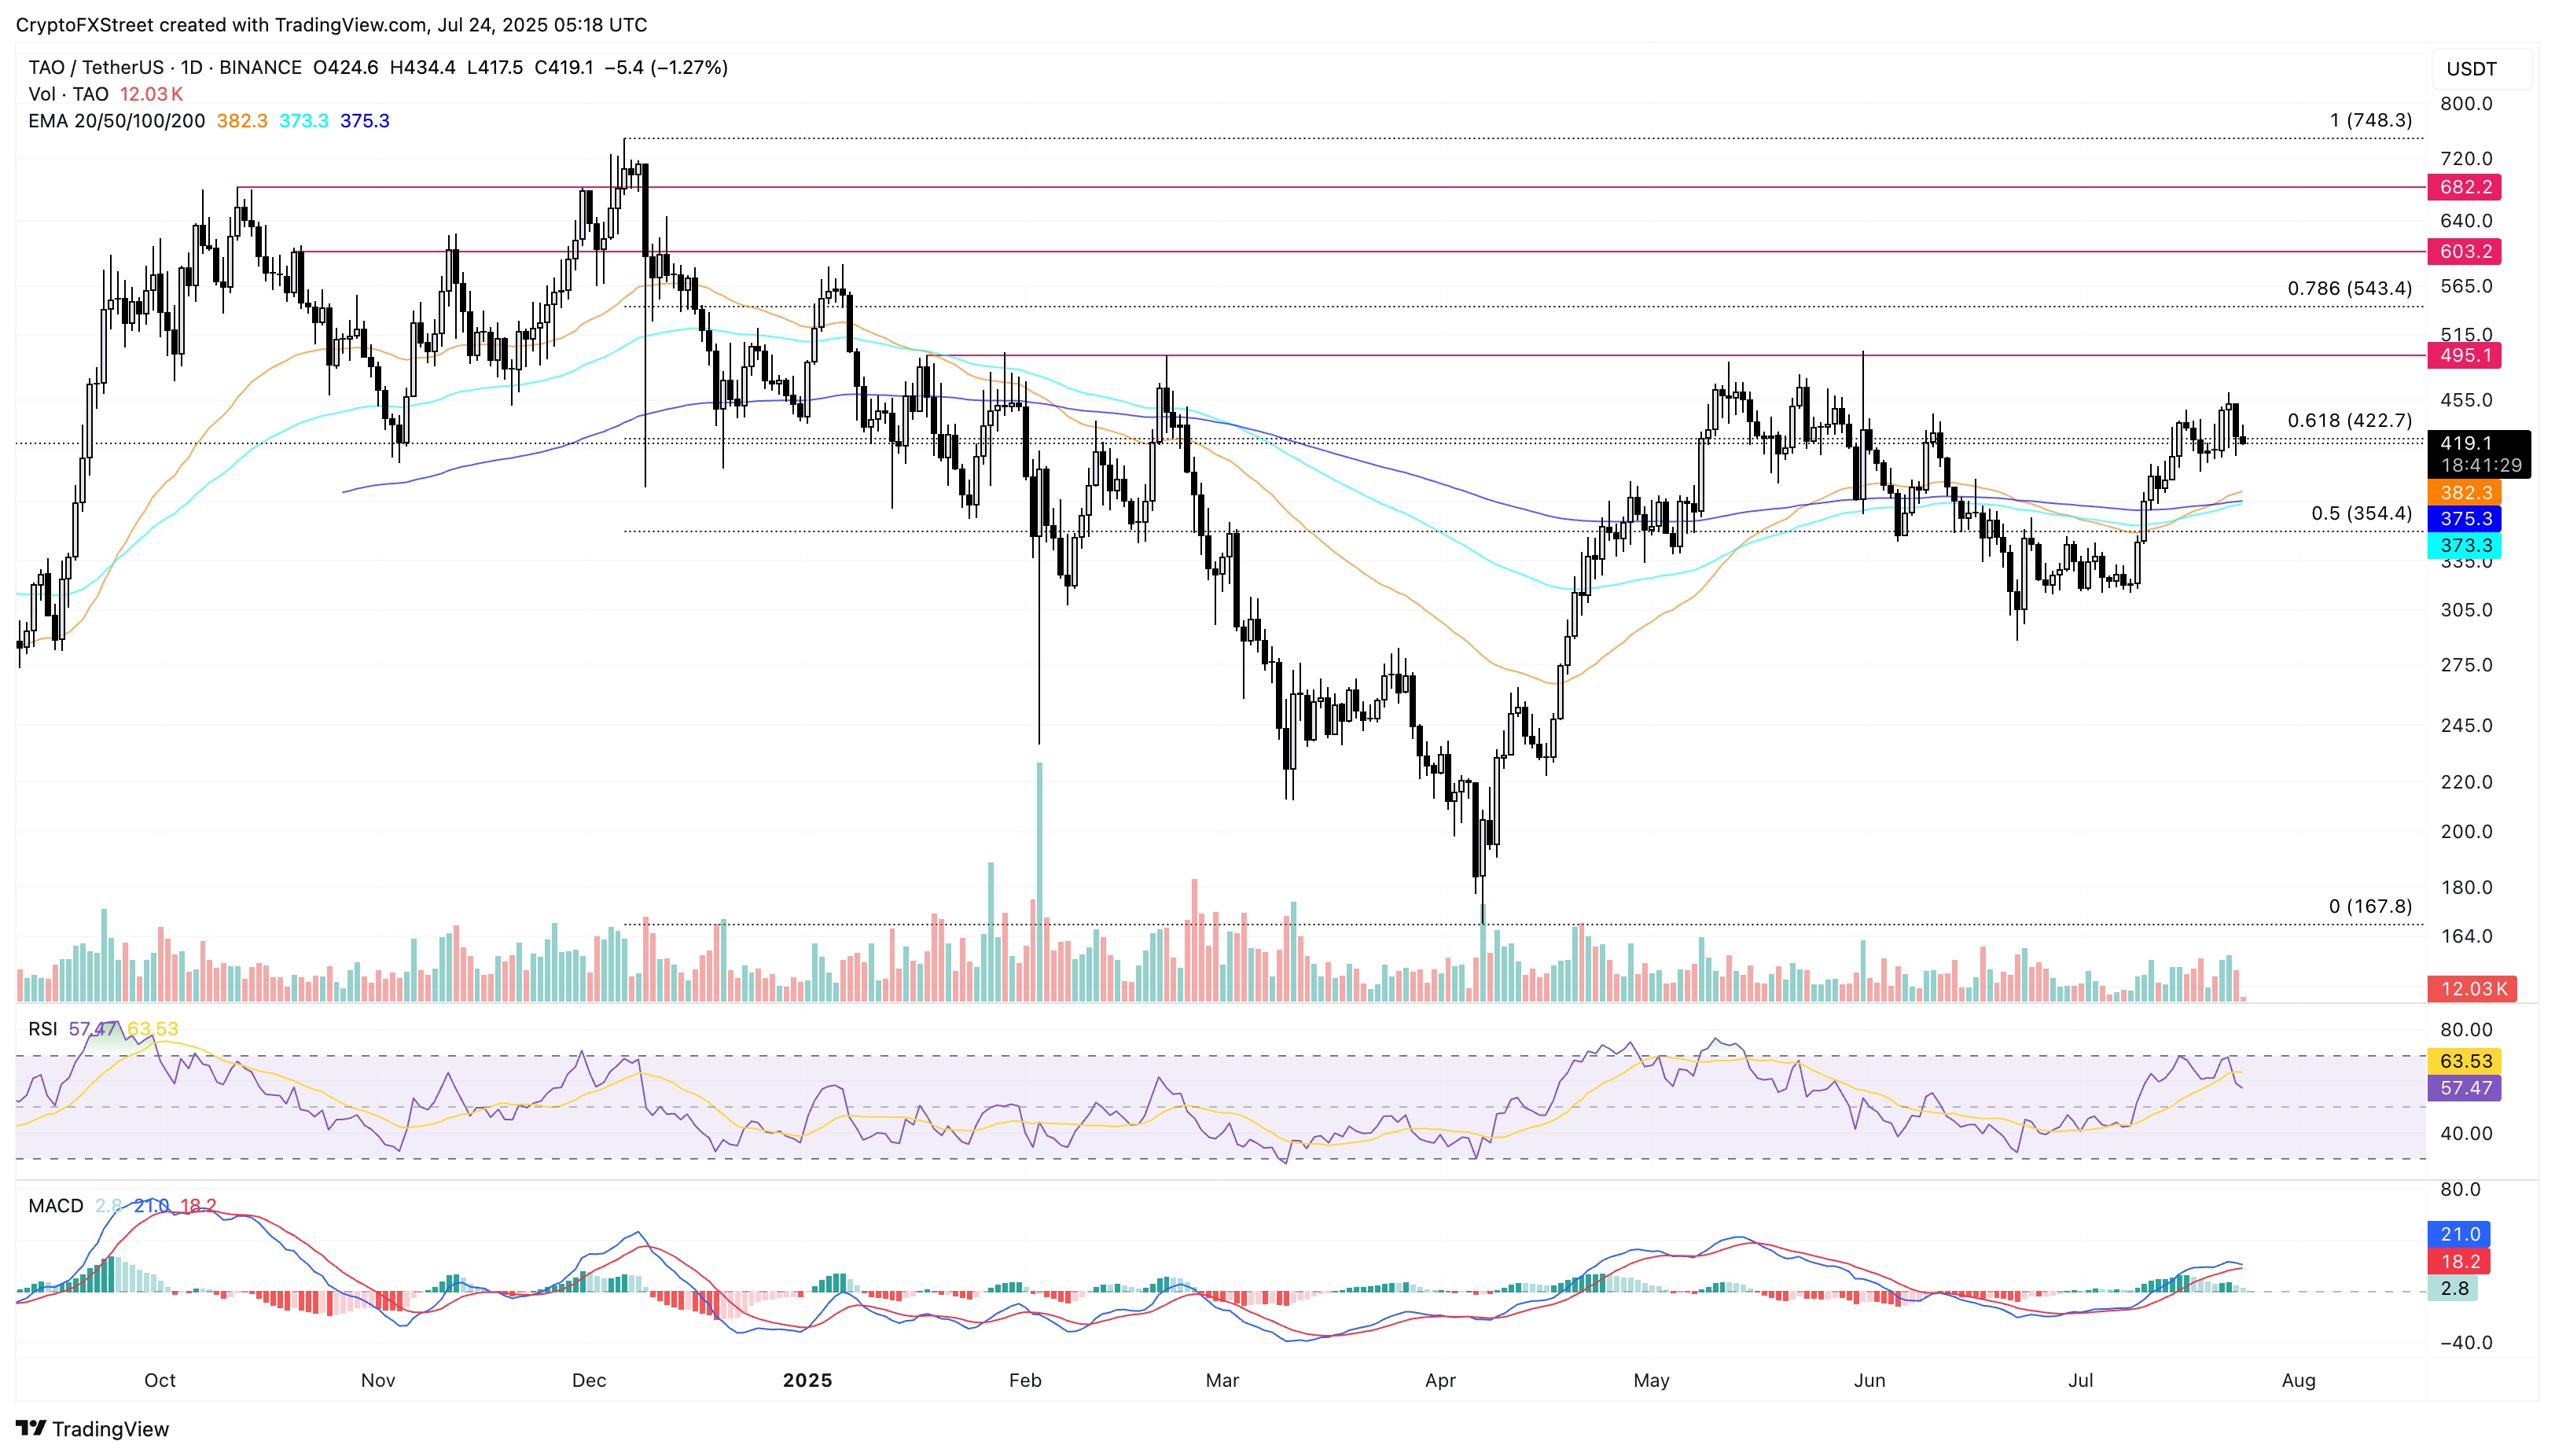
TAO/USDT daily price chart.
To reinforce a bullish trend, the AI crypto must surpass the weekly high of $461 and the $495 resistance level, last tested on May 31. The breakout rally could extend the trend to the 78.6% Fibonacci level at $543.
FET nears a bullish pattern breakout, aims to reclaim $1
FET edges lower by nearly 4% at the time of writing so far this week as it hits the 38.2% Fibonacci level at $0.834 drawn from the March 25 high at $3.48 to the April 7 low at $0.34. The technical outlook suggests that FET is on the verge of a cup and handle pattern breakout, with the $0.834 level serving as the overhead resistance.
Traders should be on the lookout for a decisive weekly close above the $0.834 resistance, which could stretch the bullish run to the 50% Fibonacci level at $1.09.
The MACD indicator shows a gradual recovery in bullish momentum on the weekly chart as the MACD and its signal line rise towards the zero line. Still, the RSI remains neutral at 48, slightly below the midpoint line.
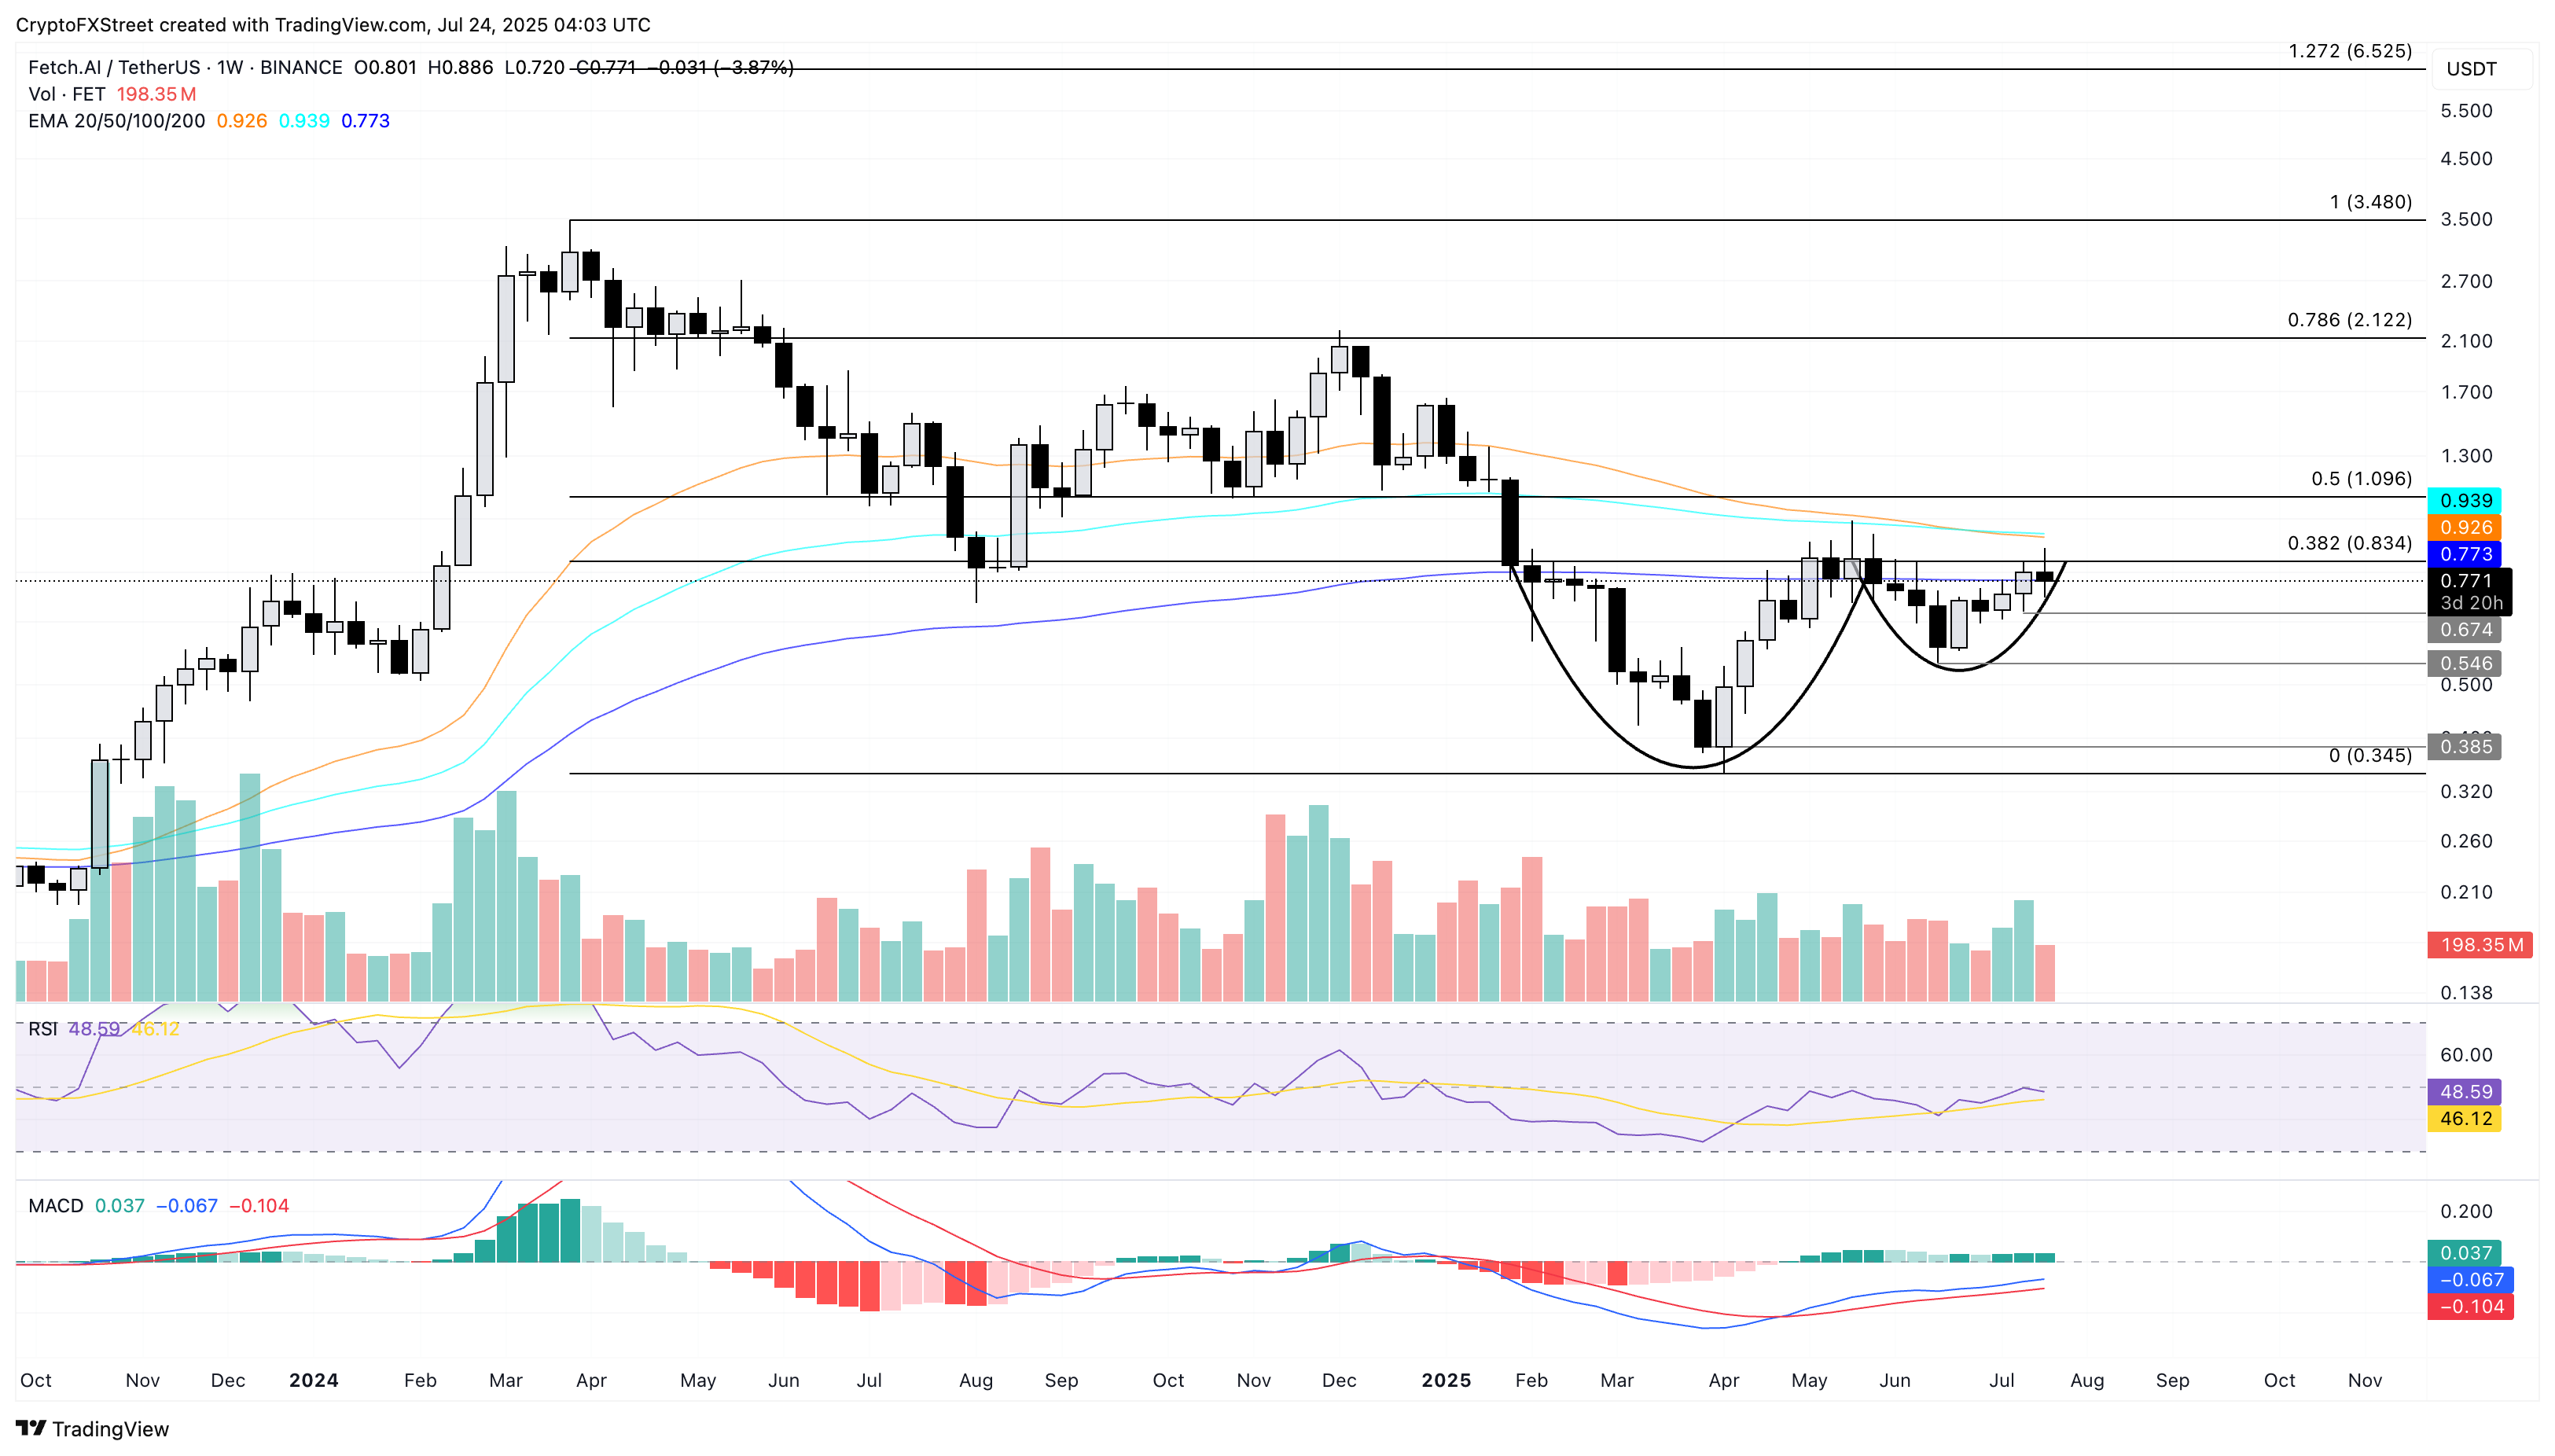
FET/USDT weekly price chart.
On the flipside, a reversal below the previous week’s low at $0.67 could retest June’s low at $0.54.
Internet Computer loses steam, retests the 100-day EMA
Internet Computer edges lower by 2% at press time on Thursday, extending the 8% drop from Wednesday. ICP lost steam after testing the 200-day EMA at $6.20, erasing the 9% gains from last week, fueled by a trendline breakout and the launch of CaffeineAI.
At the time of writing, the AI crypto token retests the 100-day EMA and inches closer to the broken resistance trendline. Traders should remain cautious, as a correction below the $5.00 psychological level could invalidate the trendline breakout, potentially extending the decline to the $4.50 support zone, marked green on the daily chart.
The MACD indicator is on the verge of flashing a reversal sign as green histogram bars descend, while the RSI at 50 (neutral) indicates a sudden drop in buying pressure as it reverses from the overbought boundary.
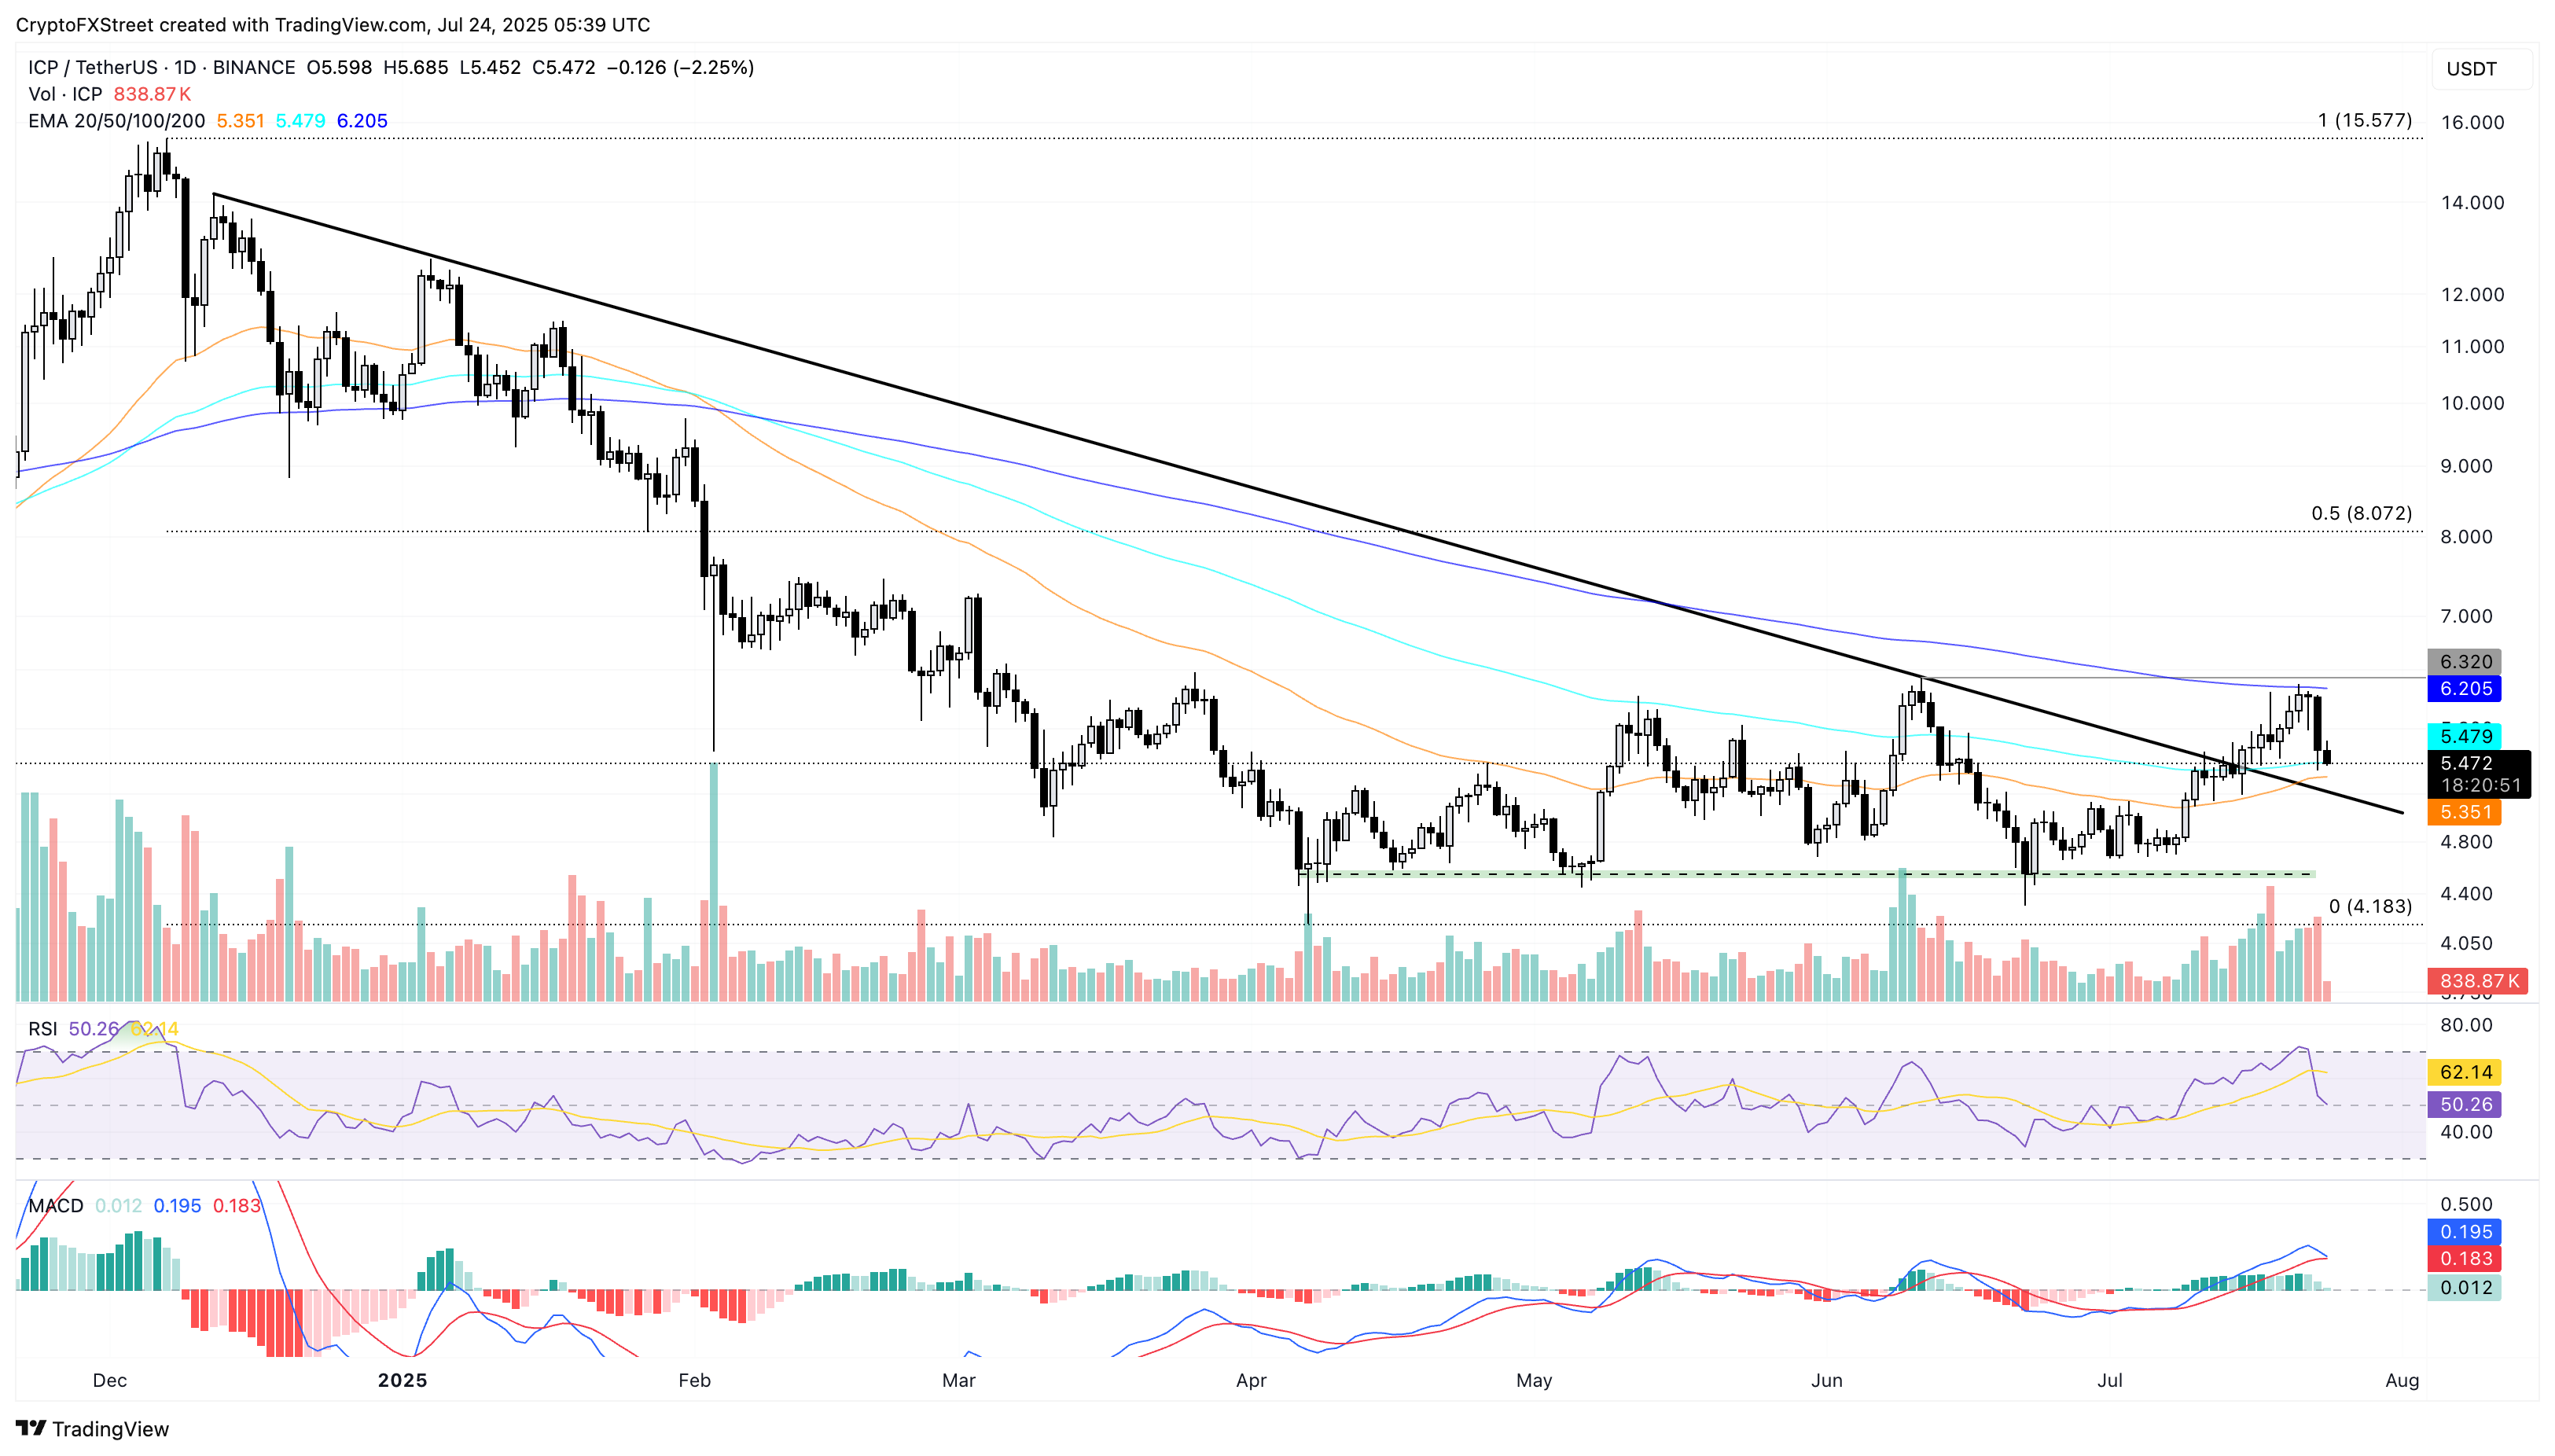
ICP/USDT daily price chart.
In the event of an interest surge in AI crypto tokens, ICP must surpass the 200-day EMA to reinforce a bullish trend, which could test the 50% Fibonacci level at $8.07, drawn from the 15.57 peak of December 7 to the $4.18 low of April 7.
