Stellar (XLM) Primed for Breakout: Record Open Interest Fuels Bullish Charge Toward Key Psychological Level

Stellar's derivatives market just flashed its most bullish signal yet—and traders are loading up for a potential price explosion.
Open interest in XLM futures just smashed its all-time high. That means big money's betting big on this altcoin's next move.
Key psychological resistance looms ahead. If bulls can punch through? Fasten your seatbelts.
(Of course, Wall Street's still trying to explain how a 'meme stock' from 2021 outperformed their entire crypto portfolio.)
XLM Open Interest hits all-time high
CoinGlass’ data shows a 17% surge in XLM Open Interest (OI) over the last 24 hours, reaching $602.39 million. The spike in OI translates to increased capital inflow in the derivatives market amid rising interest in traders.
A sharp rise in OI-weighted funding rate to 0.0327%, up from 0.0114% on Thursday, indicates a bullish incline in trading activity. Bulls pay the positive funding rates to offset the swap and spot price imbalance arising due to increased buying pressure in the derivatives market.
The bullish run in XLM wipes out $6.06 million in short positions in the last 24 hours, compared to $2.91 million in long positions, indicating a massive shakeout of bearish traders.
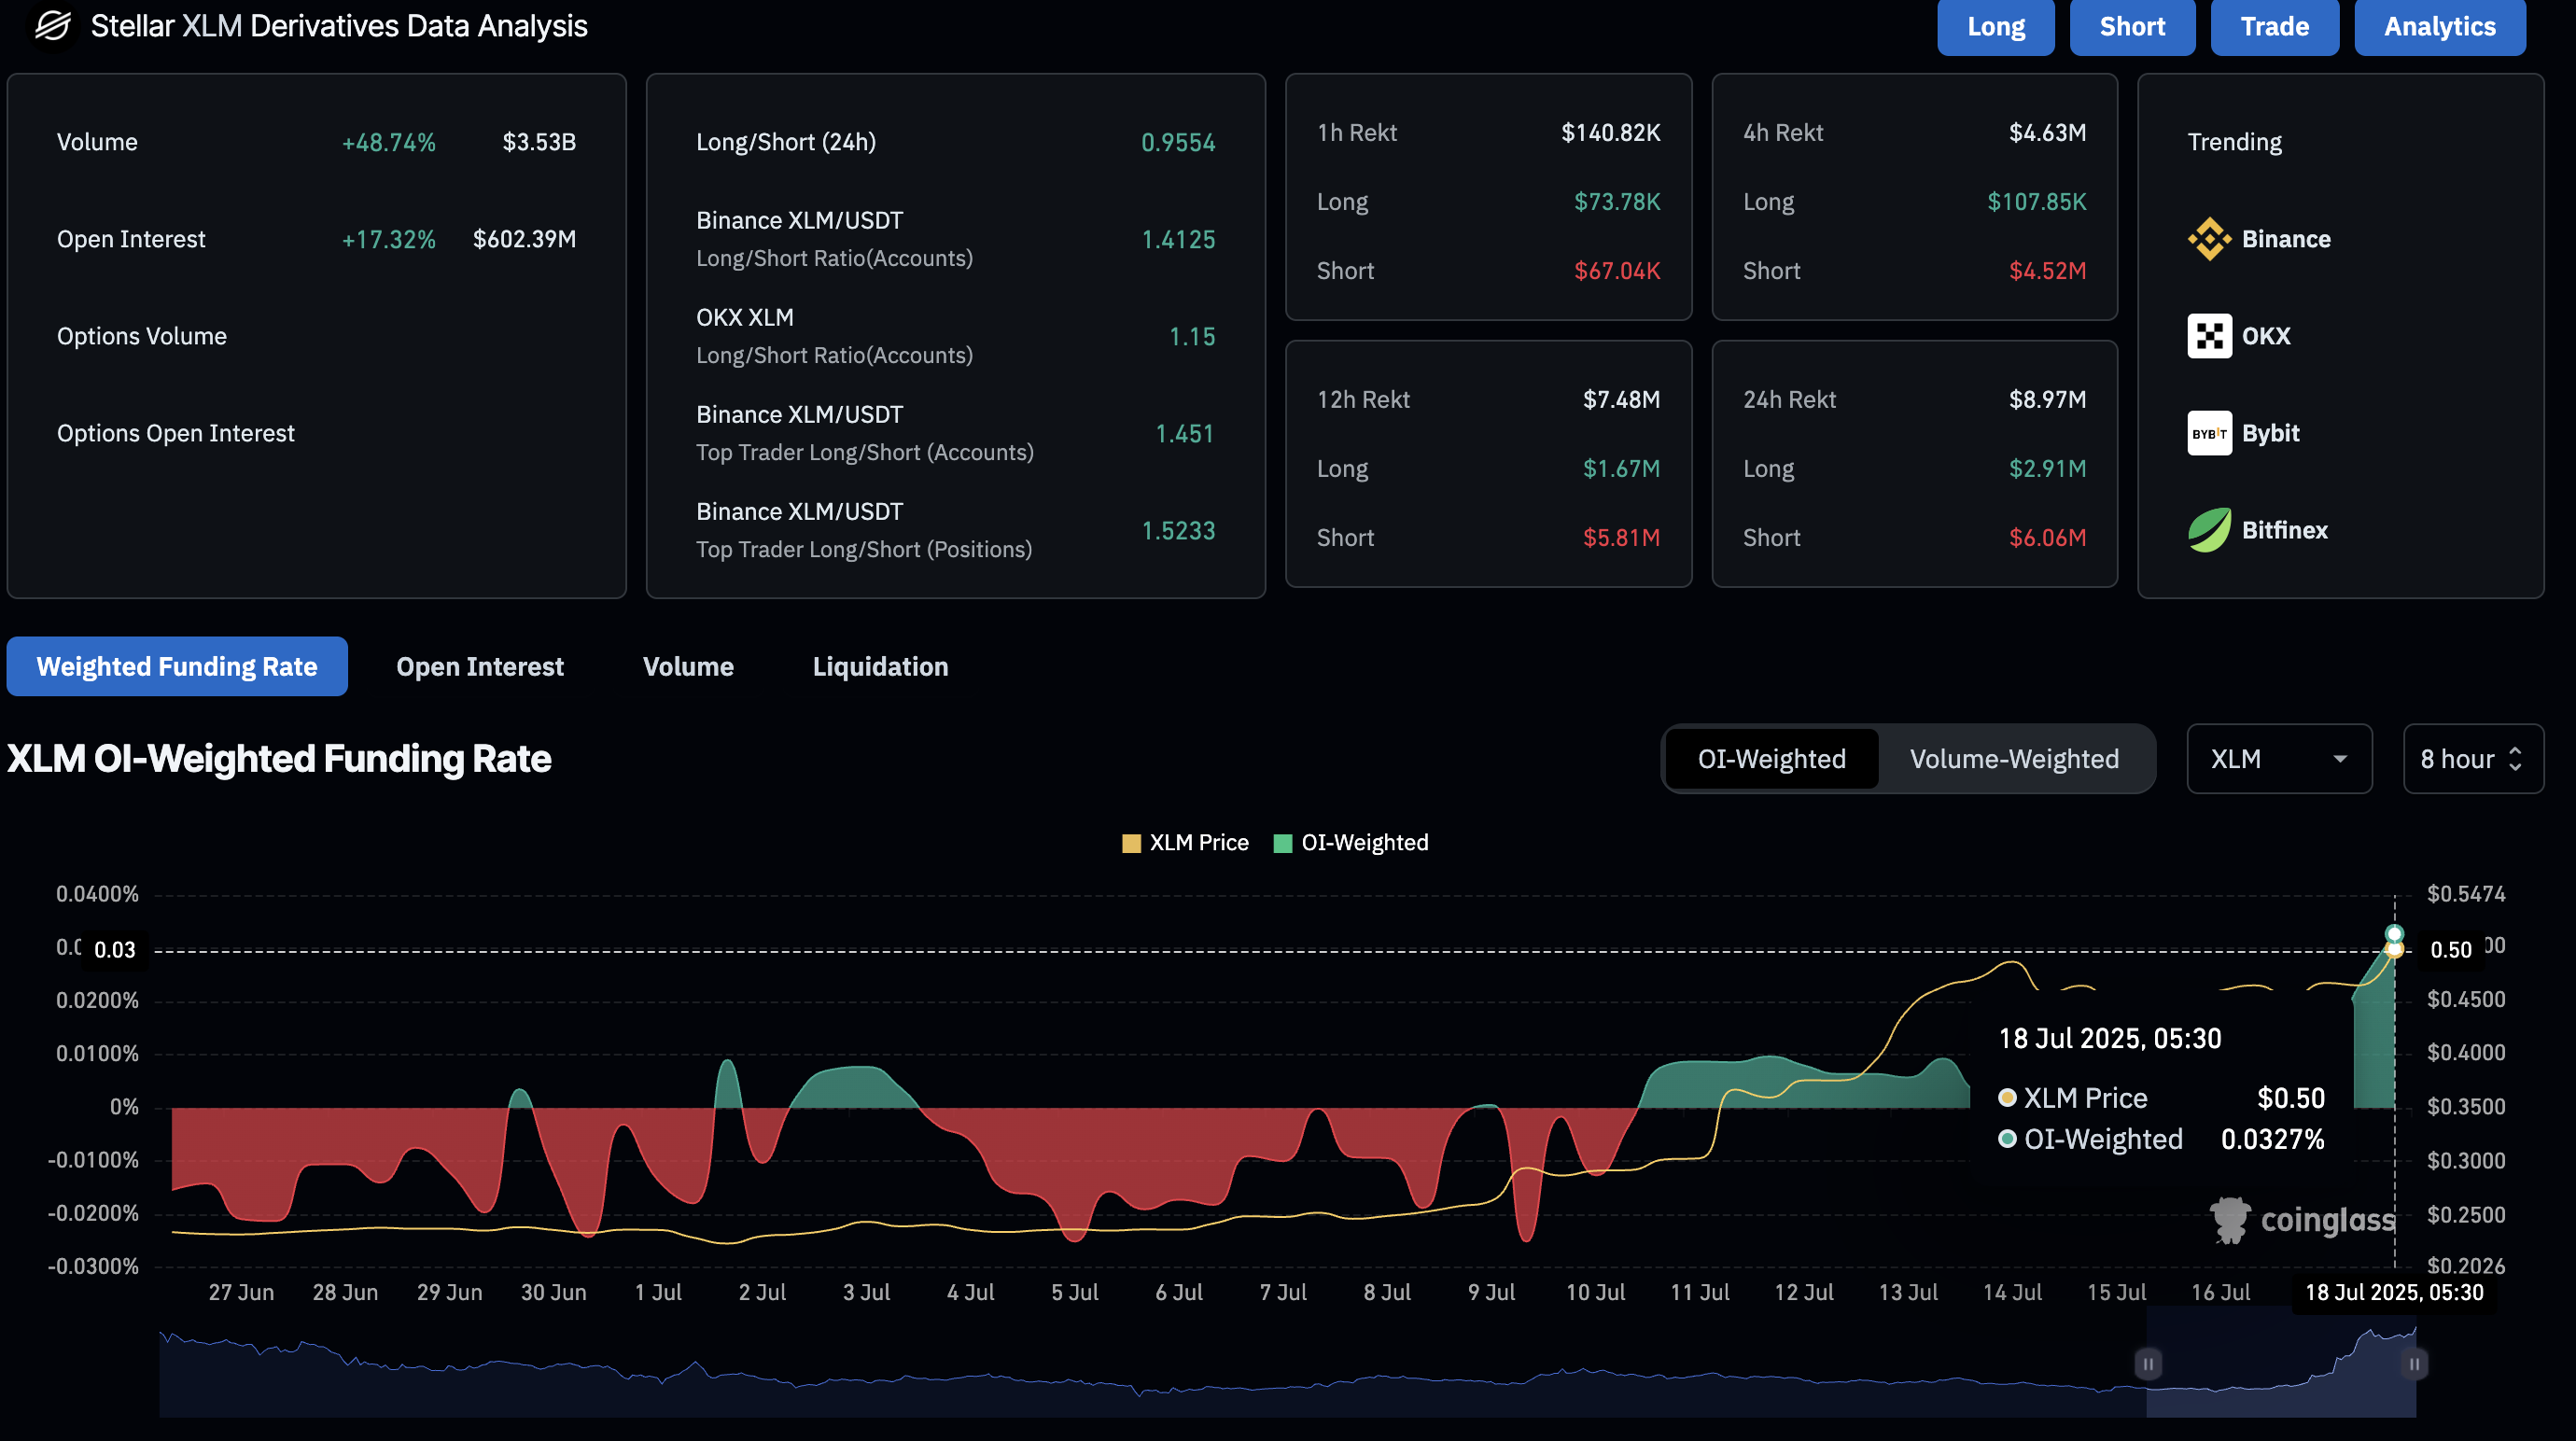
XLM Derivatives data. Source: Coinglass
Peter Brandt notes two conditions for Stellar to enter a bull run
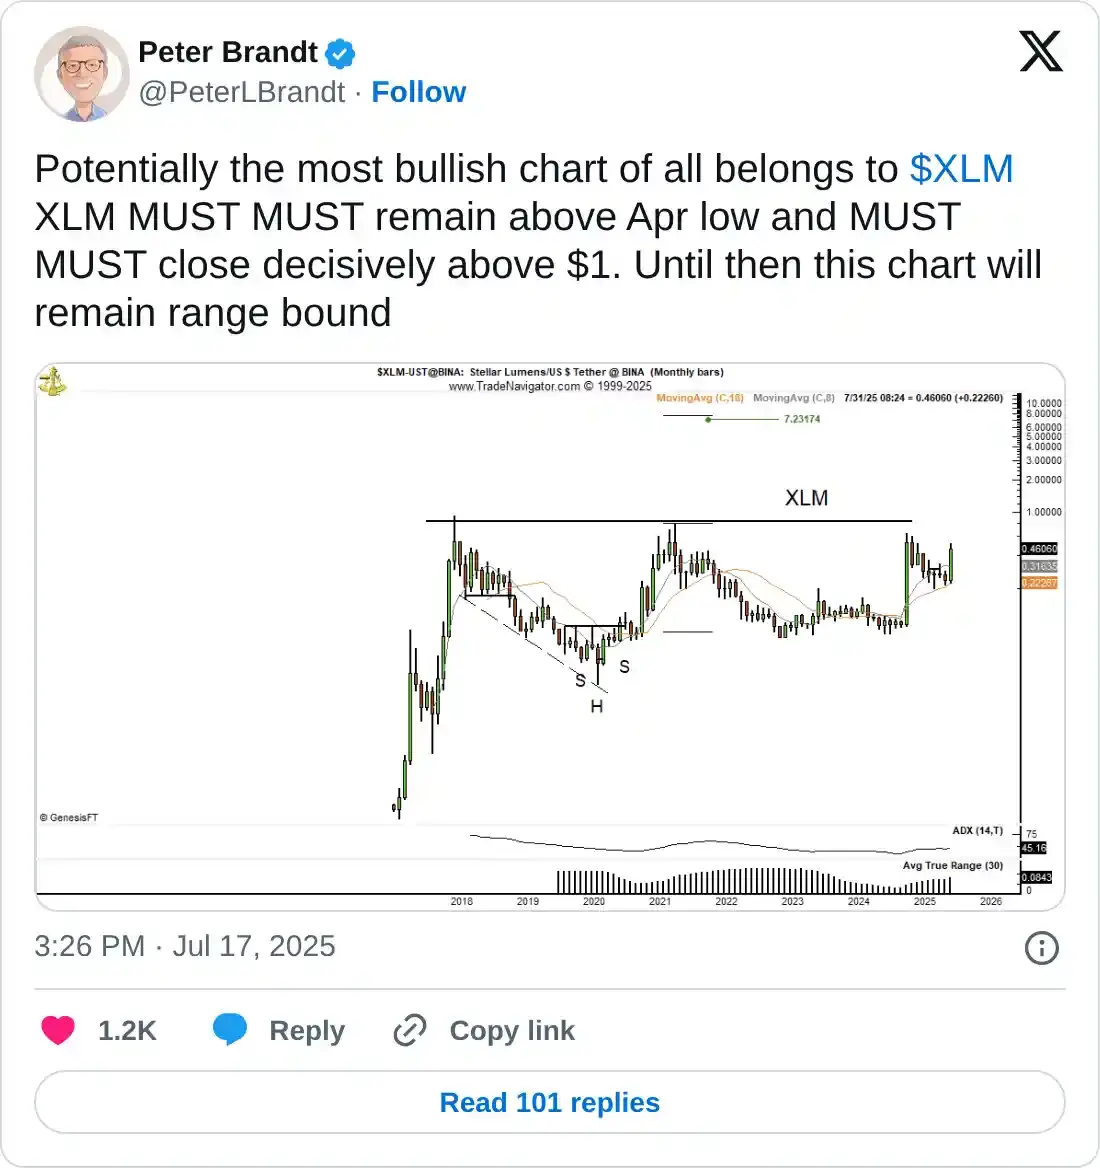
On Thursday, Peter Brandt, a veteran analyst, shared a monthly XLM/USDT price chart on a X post. The analyst highlights a range-bound movement in XLM with the upper boundary ceiling at the $1.00 psychological level.
Brandt suggests a highly optimistic price target of $7.23 if XLM marks a decisive close above the $1.00 mark. However, investors must pay attention to Peter’s second condition of “XLM MUST MUST remain above Apr low.”
If XLM fails to hold above the April low at $0.20, it could further extend the range-bound movement.
XLM’s triangle breakout rally stalls near $0.50
Stellar upholds descending triangle breakout rally on the daily chart, facing opposition at the $0.50 psychological level. At the time of writing, XLM's intraday price movement reflects indecisiveness, as indicated by a Doji candle forming on the daily chart.
However, the 24-hour high of $0.52 records a new year-to-date high in XLM. The altcoin is up 105% so far in July, with bulls aiming to reclaim the $0.50 level.
A daily close above this level could extend the uptrend to the highest daily close of December at $0.56. Beyond this, bulls could target the 1.272% Fibonacci level at $0.72, drawn between the daily closes of December 1 at $0.56 and April 8 at $0.22.
The Moving Average Convergence/Divergence (MACD) and its signal line surge higher in the positive territory, fueled by a surge in green histogram bars. Investors could consider this a sign of increasing bullish momentum.
The Relative Strength Index (RSI) reads 85, maintaining a sideways trend in the overbought zone amid extreme buying pressure.
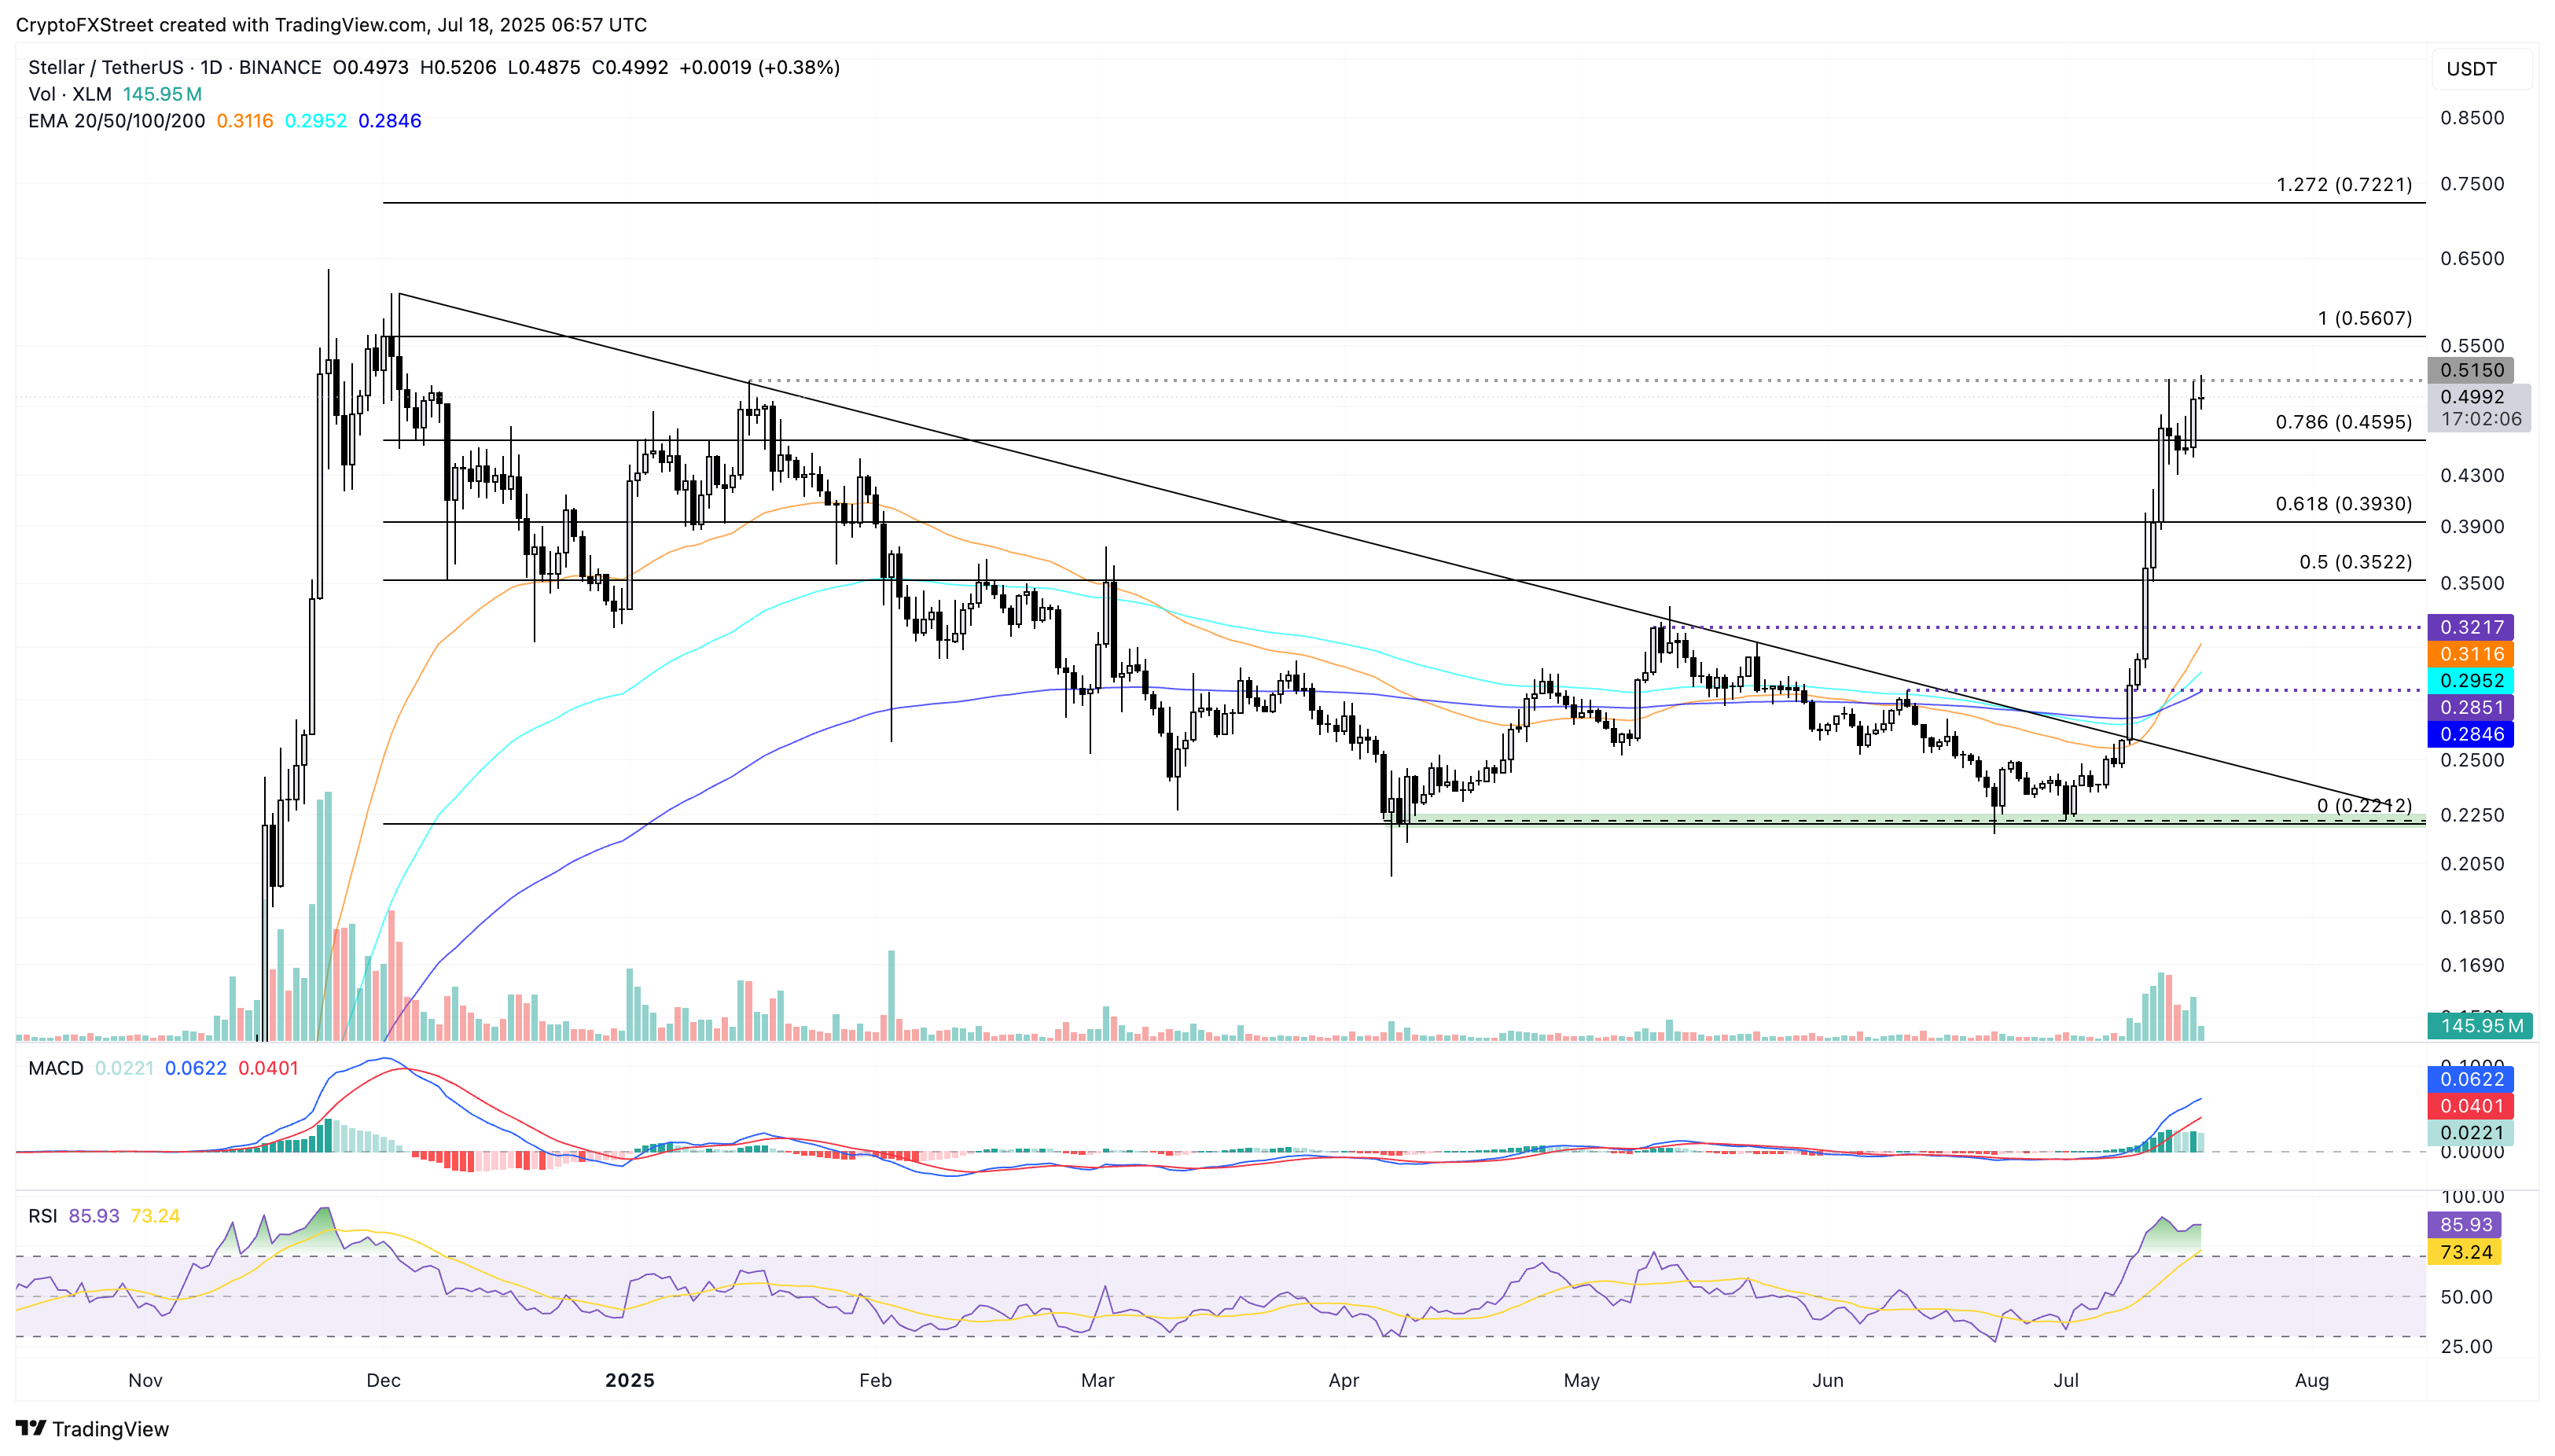
XLM/USDT daily price chart.
On the contrary, a reversal from the $0.50 level could result in a steeper correction in XLM to the 78.6% Fibonacci retracement level at $0.45.
