Ethereum’s Surge to $6,000+: Where Will the Rally Hit a Speed Bump?

Ethereum's bull run is turning heads—but even rockets need to refuel. Here's where the $6K+ climb might take a breather.
The psychological barrier: $6,000 isn't just a number
Traders love round numbers like Wall Street loves bailouts. Watch for profit-taking as ETH nears this milestone.
Liquidity zones: The hidden traps
Order books get thin at key levels. If too many weak hands pile in at $5,800-$6,200, brace for a shakeout.
Macro won't care about your moon math
Fed rate decisions or a crypto-unfriendly regulation could slam the brakes faster than a Bitcoin maximalist dismissing altcoins.
Ethereum's fundamentals look stronger than a DeFi degens' coffee—but in crypto, even the best rallies eat a 20-30% correction for breakfast.
Figure 1. Our preferred short-term EW count for Ethereum
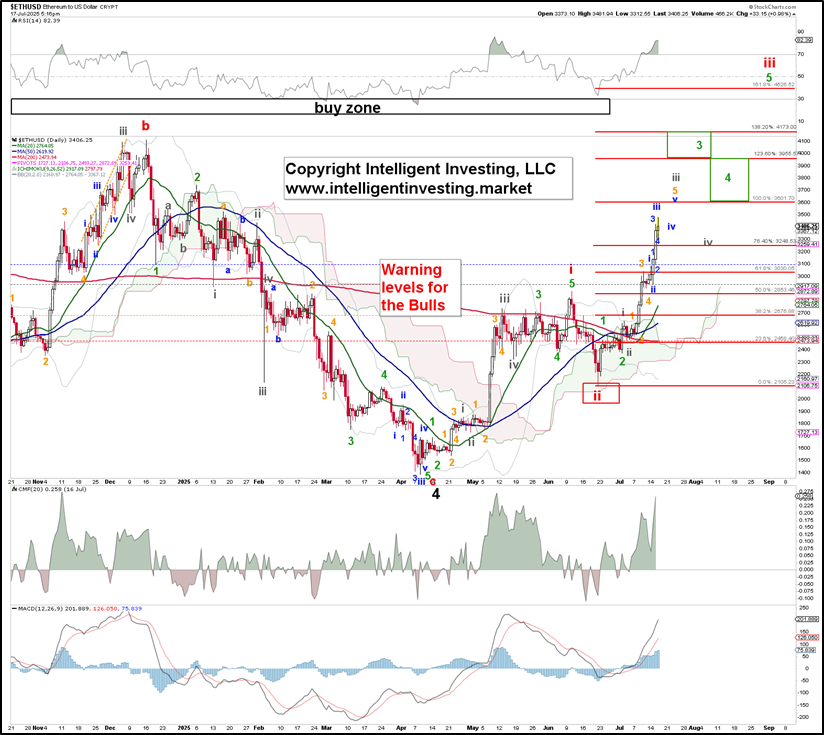
In this case, we expect the first short-term top to materialize around the red 100% Fibonacci extension, approximately $3,600, for the gray W-iii—a typical 3rd of a 3rd of a 3rd wave target. The subsequent multi-day gray W-iv correction should ideally stall out at around the 76.40% level ($3250ish) before the gray W-v aims for the 123.60-138.20% extensions ($3955-4175), etc. We don’t see a more severe (multi-week) correction play out until the red W-iii has been completed at ideally the 161.8% level: ~$4525.
How does this fit into the bigger picture, one may ask? Remember, three months ago, we demonstrated that Ethereum was nearing the end of its downtrend.
“…. [it] can still wrap up at least one more set of 4th and 5th waves to the ideal $1085ish target zone to complete the more significant (black) 4th wave. However, if ETH moves above at least the 50-d SMAs, the DT line, and $2093 without making a lower low first, we must consider the four-month-long downtrend complete and look towards the low $6000s over the next several months.”
Ether failed to reach that target, having bottomed out at $1,384 on April 9, and then moved above its 50-day SMA and downtrend line, thus indicating that the rally to $6,000+ was underway. That target was set based on the large Bull flag pattern that was forming. See Figure 2 below.
Figure 2. Our preferred long-term EW count for Ethereum
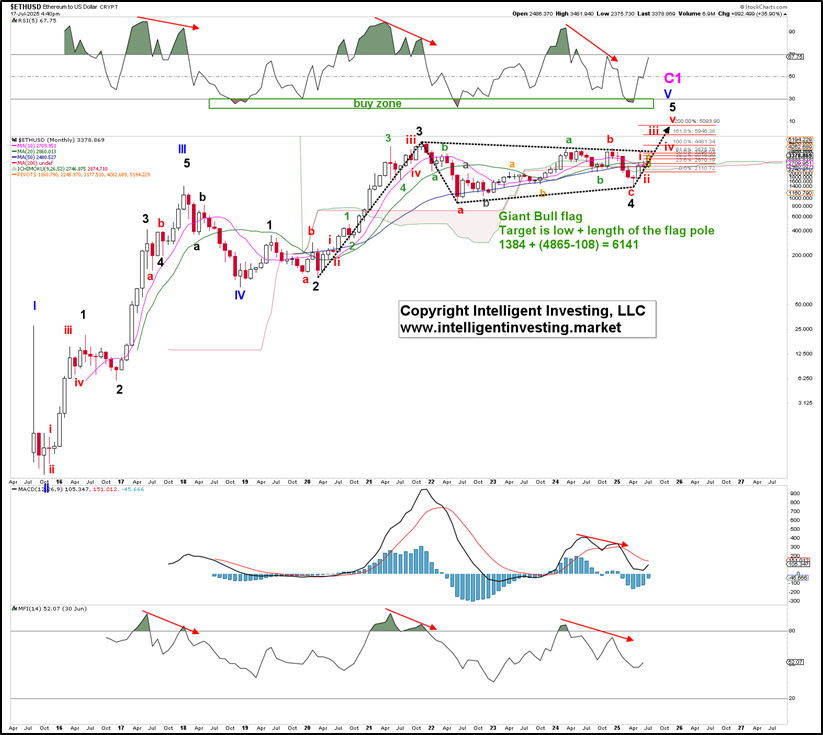
Applying the short-term to intermediate-term wave count to the price action in Figure 2 (red Fibonacci extensions), we see that the ideal (200%) 5th wave (red W-v) target for the rally from the April low is approximately $5095. The pennant formation targets $6140, and therefore, there is already a reasonable agreement between the two. Additionally, 5th waves in cryptocurrencies tend to extend, and a 300% Fib-extension targets the $6190s, which aligns even better.
Lastly, Ether has now moved above its 10 to 50-month SMAs as well as its monthly Ichimoku Cloud, signaling a renewed long-term uptrend, adding weight to the evidence for much higher prices to come.

Log in to Reply
Log in to comment your thoughtsComments
Related Articles
|Square
Get the BTCC app to start your crypto journey
Get started today Scan to join our 100M+ users