🚀 BONK, WIF, FLOKI Price Prediction: These Meme Coins Could Explode as Bitcoin Smashes ATH

Bitcoin just punched through its all-time high—again. And where BTC leads, meme coins follow. Here’s why BONK, WIF, and FLOKI might be the next to moon.
### The Meme Coin Playbook: Speculation 101
When Bitcoin rallies, altcoins—especially the meme variety—get a dopamine hit. Traders chase the next 100x bag, logic be damned. This time? The usual suspects are lining up.
### BONK: The Solana Underdog
Born as a joke, now a top-100 crypto. BONK’s got the Solana ecosystem behind it—and a community that treats ‘buy the dip’ like a religious mantra.
### WIF: The Hat-Wearing Dark Horse
Dogwifhat (yes, really) turned a Shiba Inu meme into a nine-figure market cap. Now it’s flirting with major exchange listings—because nothing says ‘legitimacy’ like a dog in a knitted beanie.
### FLOKI: Meme Coin with ‘Utility’ (Sure)
Named after Elon Musk’s dog, FLOKI’s team keeps bolting on half-baked DeFi features. But let’s be real—you’re here for the hype, not the staking APY.
### The Bottom Line
Meme coins are the lottery tickets of crypto. Bitcoin’s ATH could send them parabolic—or leave bagholders staring at -90% charts. Either way, Wall Street hedge funds are ‘researching’ them now… probably.
Bonk’s pattern breakout rally needs another bullish close
Bonk edges higher by over 2% on Friday, reaching a new 30-day high following the 12% surge on Thursday. The meme coin breaks out of an inverted head and shoulders pattern with a neckline at $0.00002375 marked by the May 10 close on the daily chart.
As BONK exceeds the neckline, it also surpasses the 50% Fibonacci retracement level at $0.00002350, which is retraced between the November 20 high of $0.00006230 and the April 7 low of $0.00000886.
If BONK upholds the neckline breakout, it could target the 61.8% Fibonacci level at $0.00002958, followed by the 78.6% level at $0.00004105.
The technical indicators display a buy signal with the crossover of the 50-day and 100-day Exponential Moving Averages (EMAs).
The momentum indicators indicate a bullish bias as the Relative Strength Index (RSI) enters the overbought zone, while the Moving Average Convergence/Divergence (MACD) indicator displays an upward trend in the MACD and its signal line.
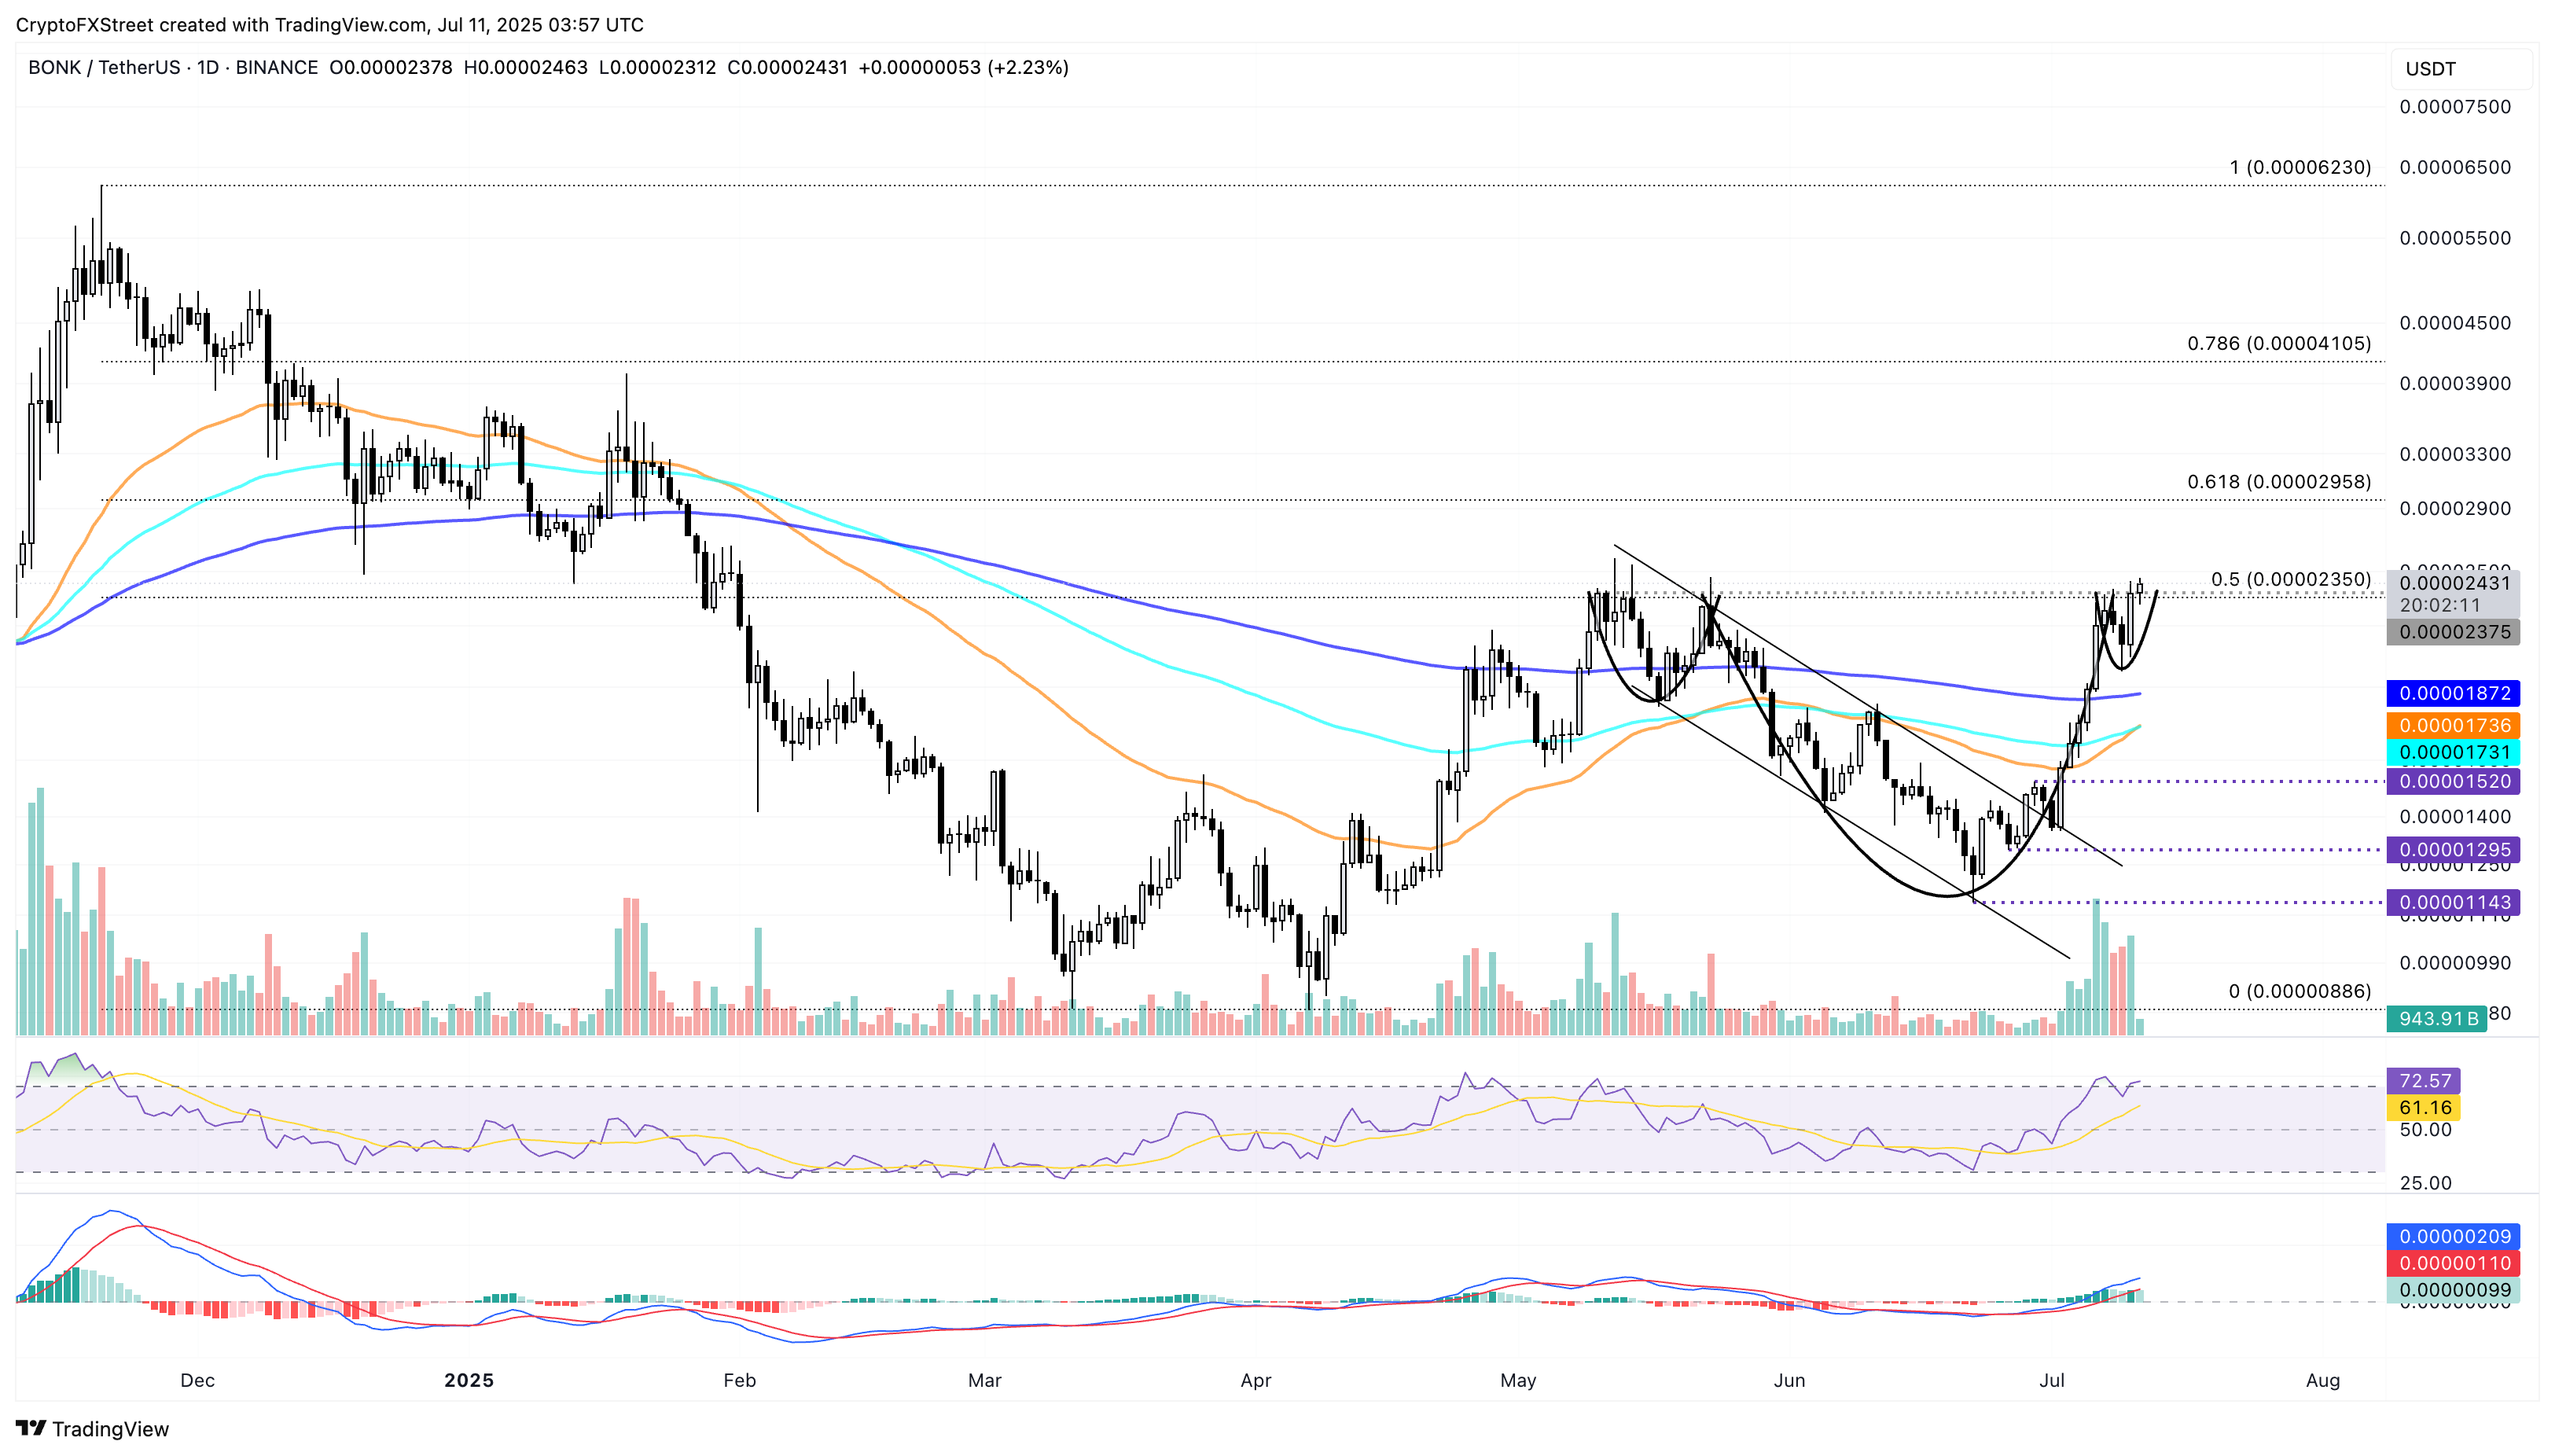
BONK/USDT daily price chart.
The 200-day EMA at $0.00001871 could absorb the incoming supply if BONK fails to sustain above the 50% Fibonacci level.
WIF aims to surpass the 200-day EMA
Dogwifhat reclaims the $1.00 round figure and edges higher to challenge the 200-day EMA at $1.066. The declining broadening wedge breakout in WIF upholds momentum with its third consecutive bullish candle.
A daily close above the 200-day EMA could propel WIF towards the 50% Fibonacci retracement level at $1.212, drawn from the November 12 peak at $4.830 to the April 9 low at $0.304. If the meme coin reclaims $1.212, it could target the 61.8% level at $1.679.
The MACD indicator displays a rising histogram from the zero line, suggesting increased bullish momentum. The RSI at 63 edges closer to the overbought zone with room for growth.
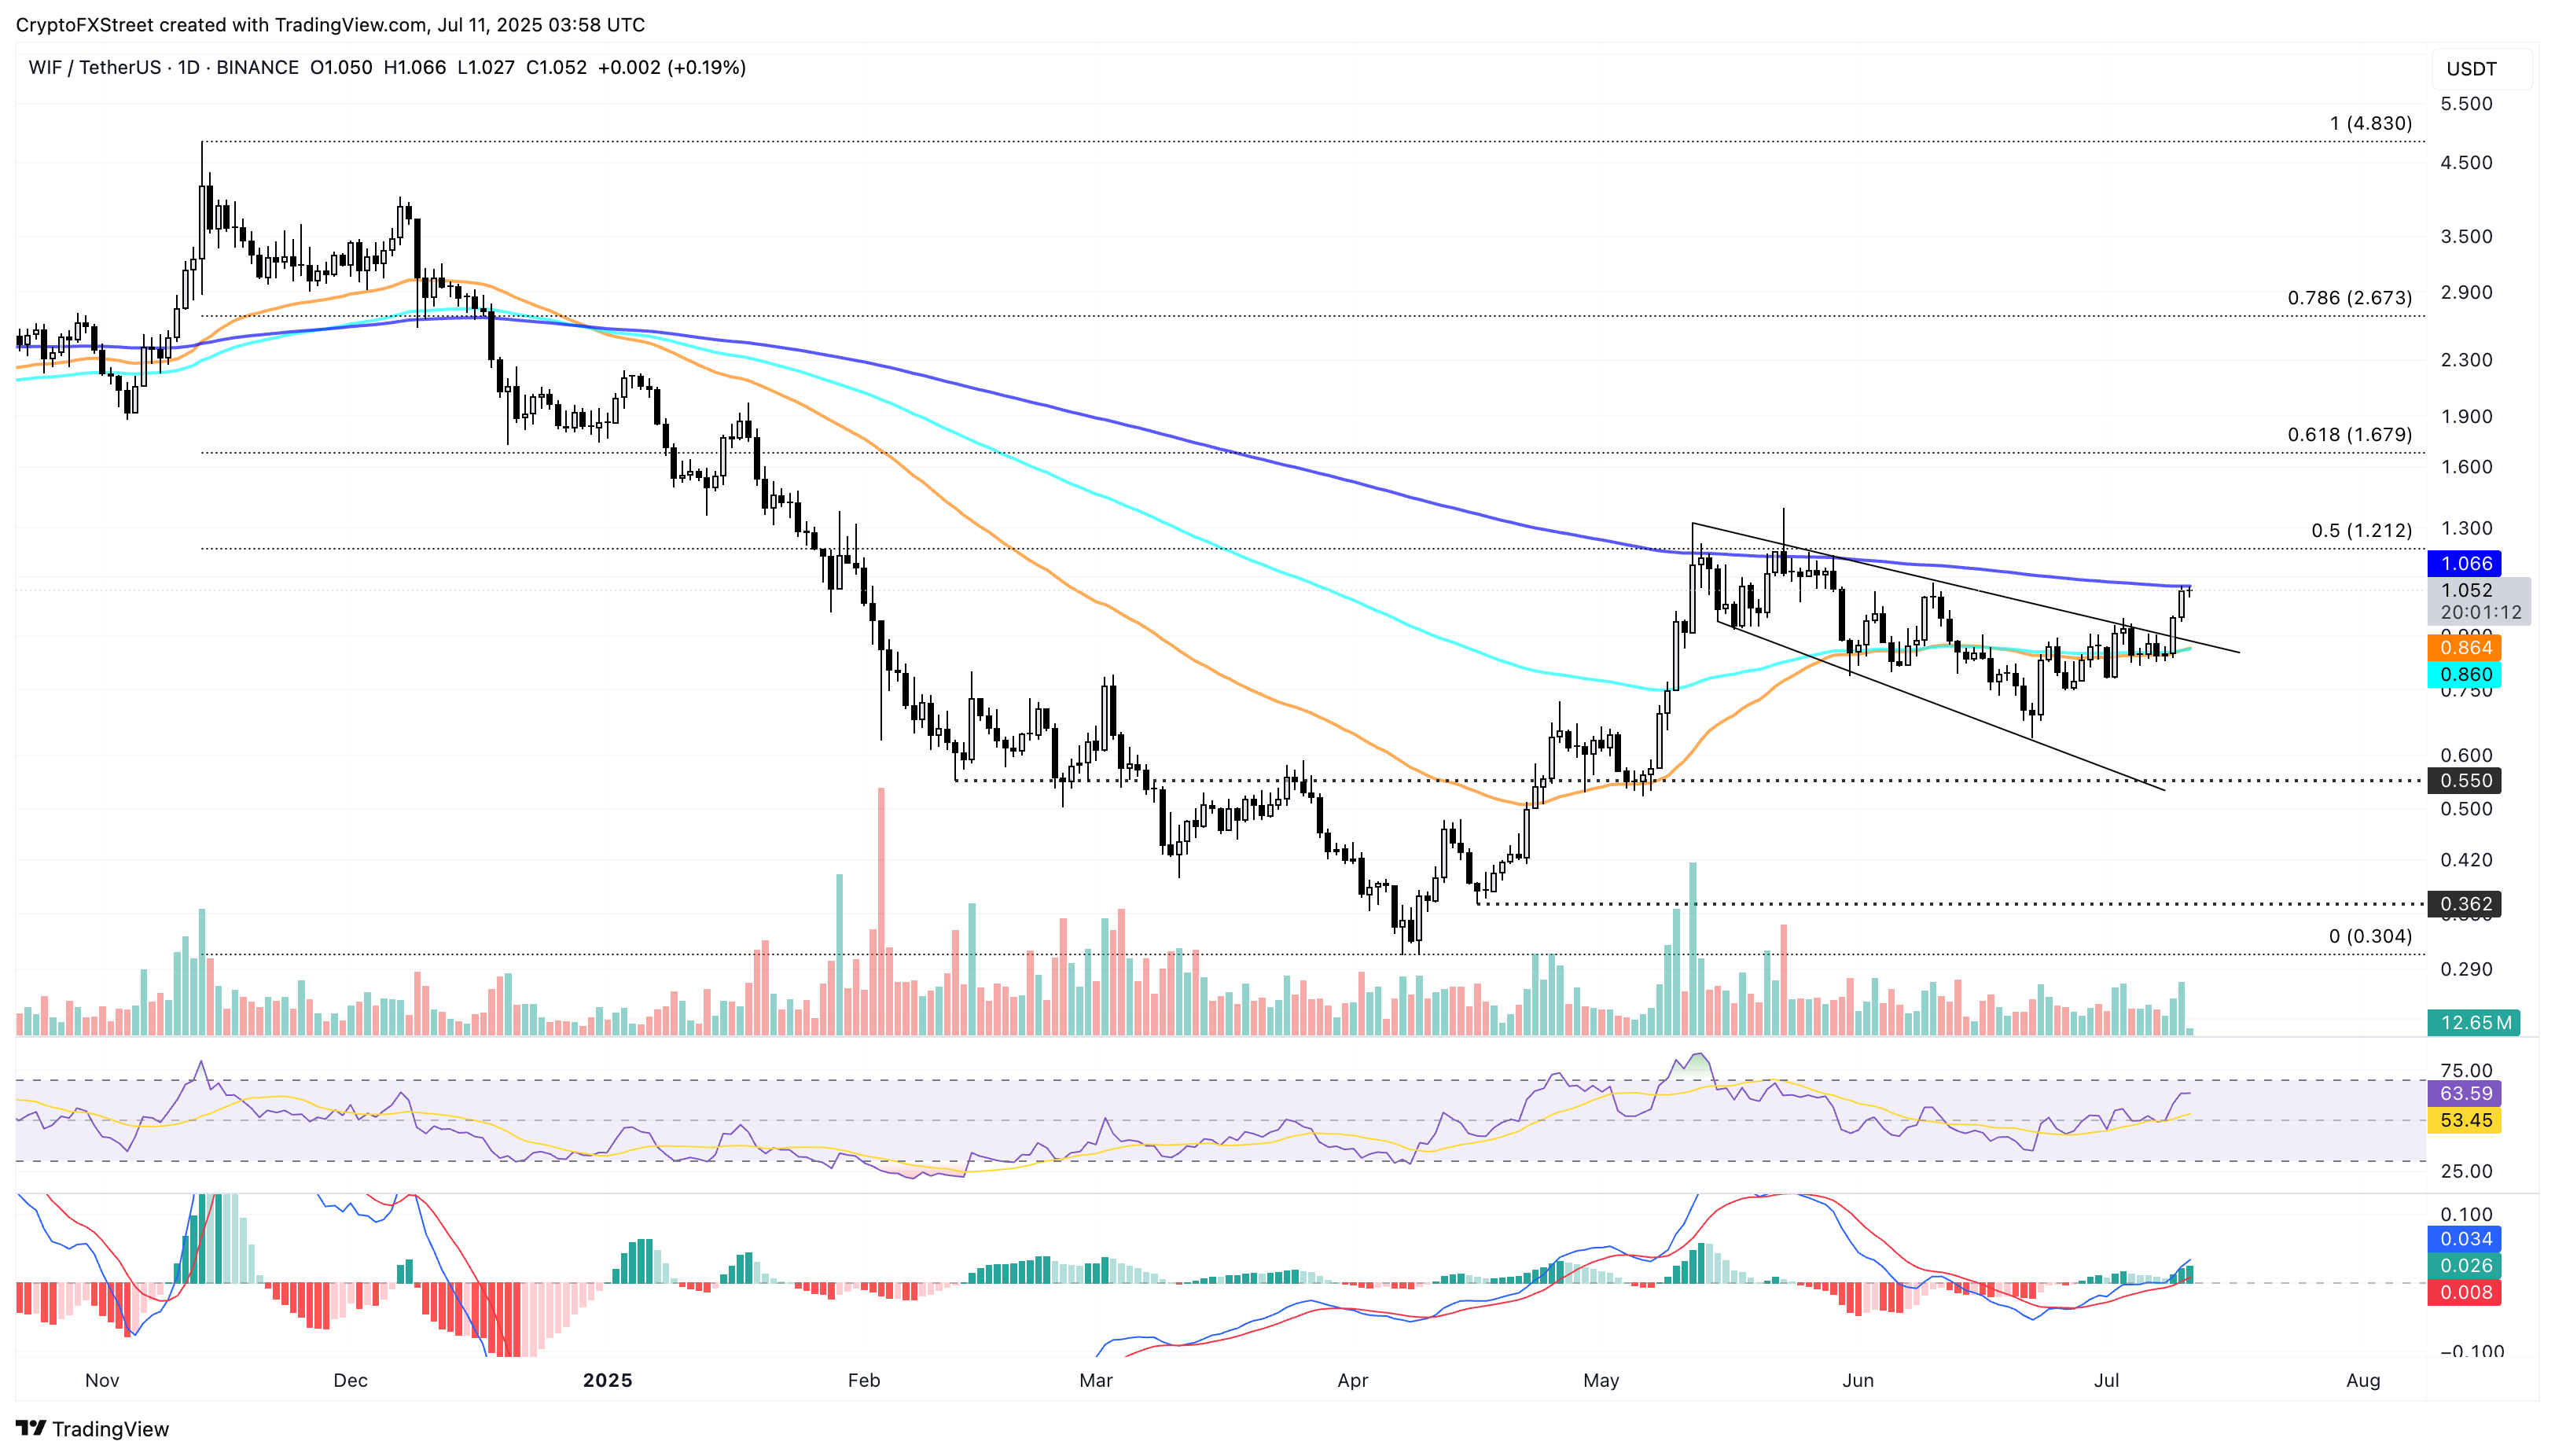
WIF/USDT daily price chart.
If WIF reverses from the 200-day EMA, it could retest the 100-day EMA at $0.860.
Channel breakout fuels FLOKI’s uptrend
Floki’s channel breakout rally exceeds the 200-day EMA and reclaims the $0.0001000 psychological level. The uptrend now aims to surpass the 50% level at $0.0001148, retraced from $0.0002900 on November 21 to $0.0000455 on April 7, marking a potential trend reversal.
Typically, investors with buying pressure above the 50% Fibonacci level fuel the buying pressure to find better exit positions. Such investors could book profits at the 61.8% Fibonacci level, located at $0.0001428, which WOULD position it as a potential resistance.
The MACD and signal lines cross above the zero line, alongside the RSI at 68, indicating a bullish shift in momentum.
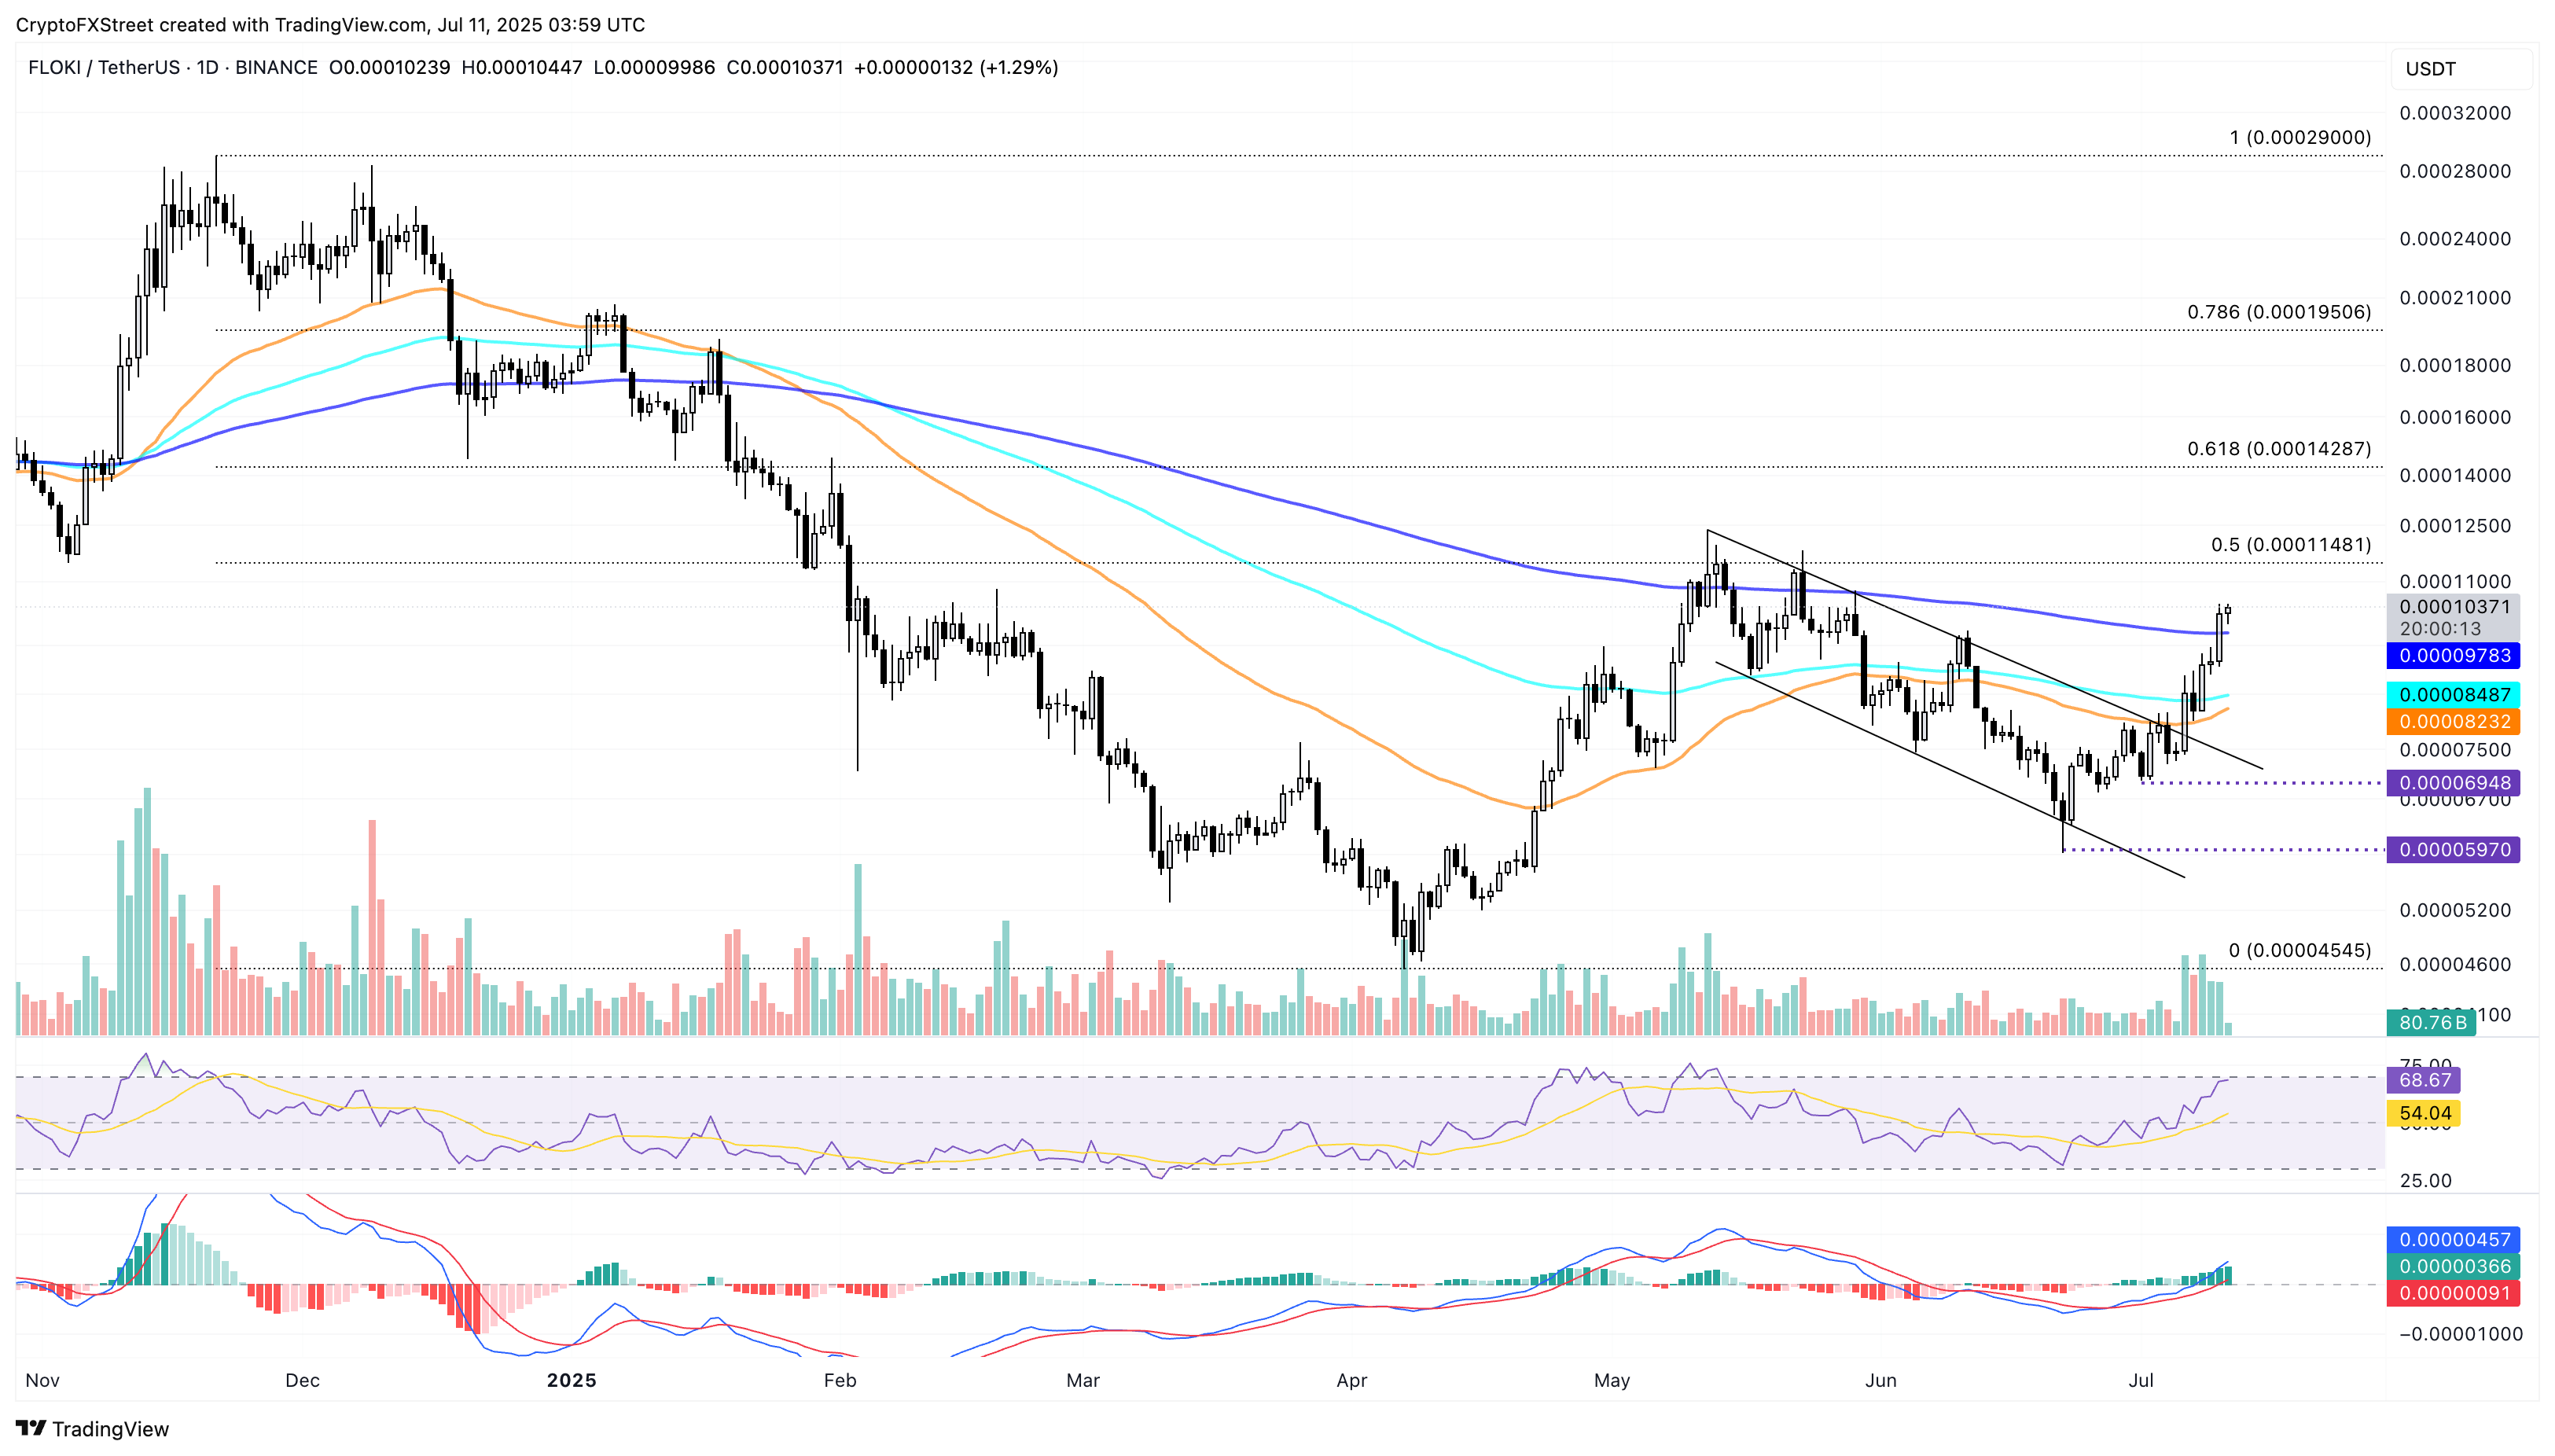
FLOKI/USDT daily price chart.
On the downside, if FLOKI fails to hold above the 200-day EMA, it could test the 100-day EMA at $0.0000848.
