Bitcoin (BTC) Shatters Records: Will History Repeat or Rally Higher?

Bitcoin just bulldozed through its previous all-time high—again. The crypto king's latest surge has traders scrambling, skeptics sweating, and Wall Street quietly updating their 'blockchain research' PowerPoints for the third time this week.
The FOMO is real, but so are the flashbacks
Remember 2021? That gut-wrenching 50% correction after BTC's last ATH? This time feels different (famous last words). Institutional adoption actually means something now—even if half these hedge funds still can't explain how a hardware wallet works.
The trillion-dollar question
With Bitcoin's market cap now rivaling some G7 economies, the real test begins. Can it stay above $70K long enough to make gold bugs cry? Or will leveraged longs turn this party into another 'we told you so' moment for Jamie Dimon?
One thing's certain: the SEC will still be debating ETF fees while retail traders YOLO into memecoins. Some things never change.
Exchange Inflows Drop; Where’s the Selling?
According to CryptoQuant, Bitcoin’s exchange inflows have plummeted to just 3,2000 BTC per day (at the time of writing), the lowest since 2015. Back in December 2024, this number was around 97,000 BTC during the $100,000 Bitcoin price breakout.
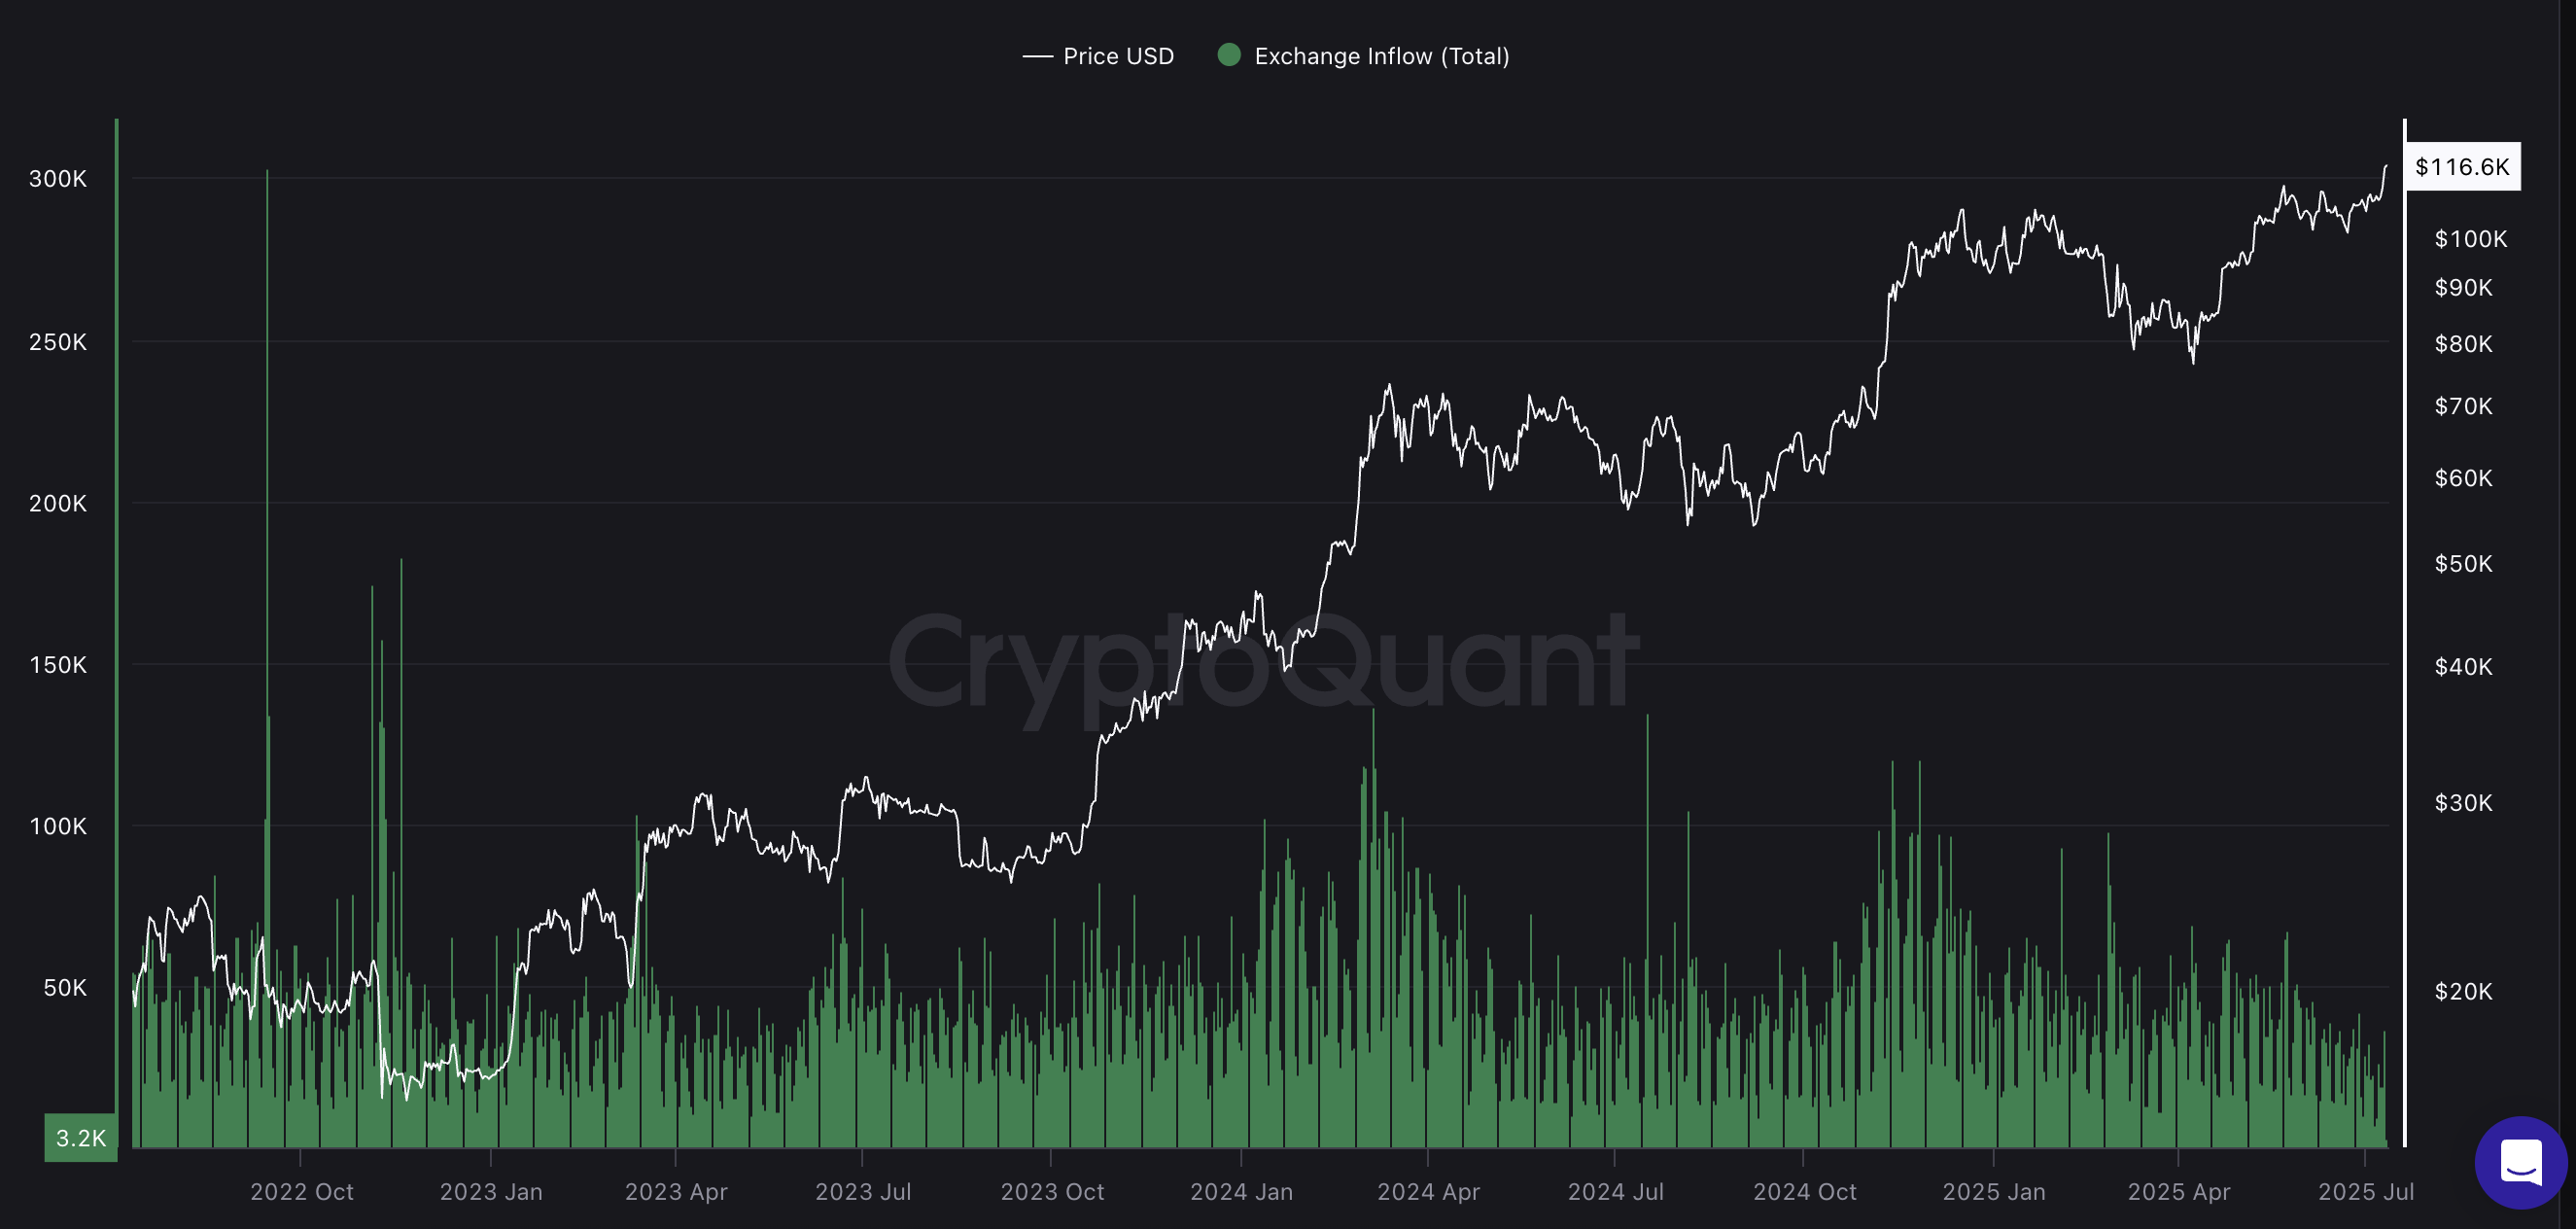
That’s a massive decline. Even at this new ATH, holders simply aren’t moving their coins to exchanges; a clear sign of low sell pressure and asset confidence.
Exchange inflows track the number of coins sent to exchanges, typically to sell. A sharp drop here signals confidence: whales and retailers are not looking to exit, at least not yet. And that alone makes a May-like dump less likely, structurally.
Moreover, in an interview with BeInCrypto, Alexander Zahnd, Ziliqa’s interim CEO, said that the momentum appears to be real.
“In the near term, the momentum appears real – institutional demand is rising, ETF inflows are strong, and companies continue to add Bitcoin to their balance sheet,” Zahnd told BeInCrypto.
Wallet Clusters Offer Support to the Bitcoin Price
Next, let’s talk defense. According to IntoTheBlock’s In/Out of Money Around Price (IOMAP) metric, over 645,000 addresses purchased BTC between $108,795 and $110,624. That’s 476.65K BTC held NEAR current levels, and it forms a major demand wall.
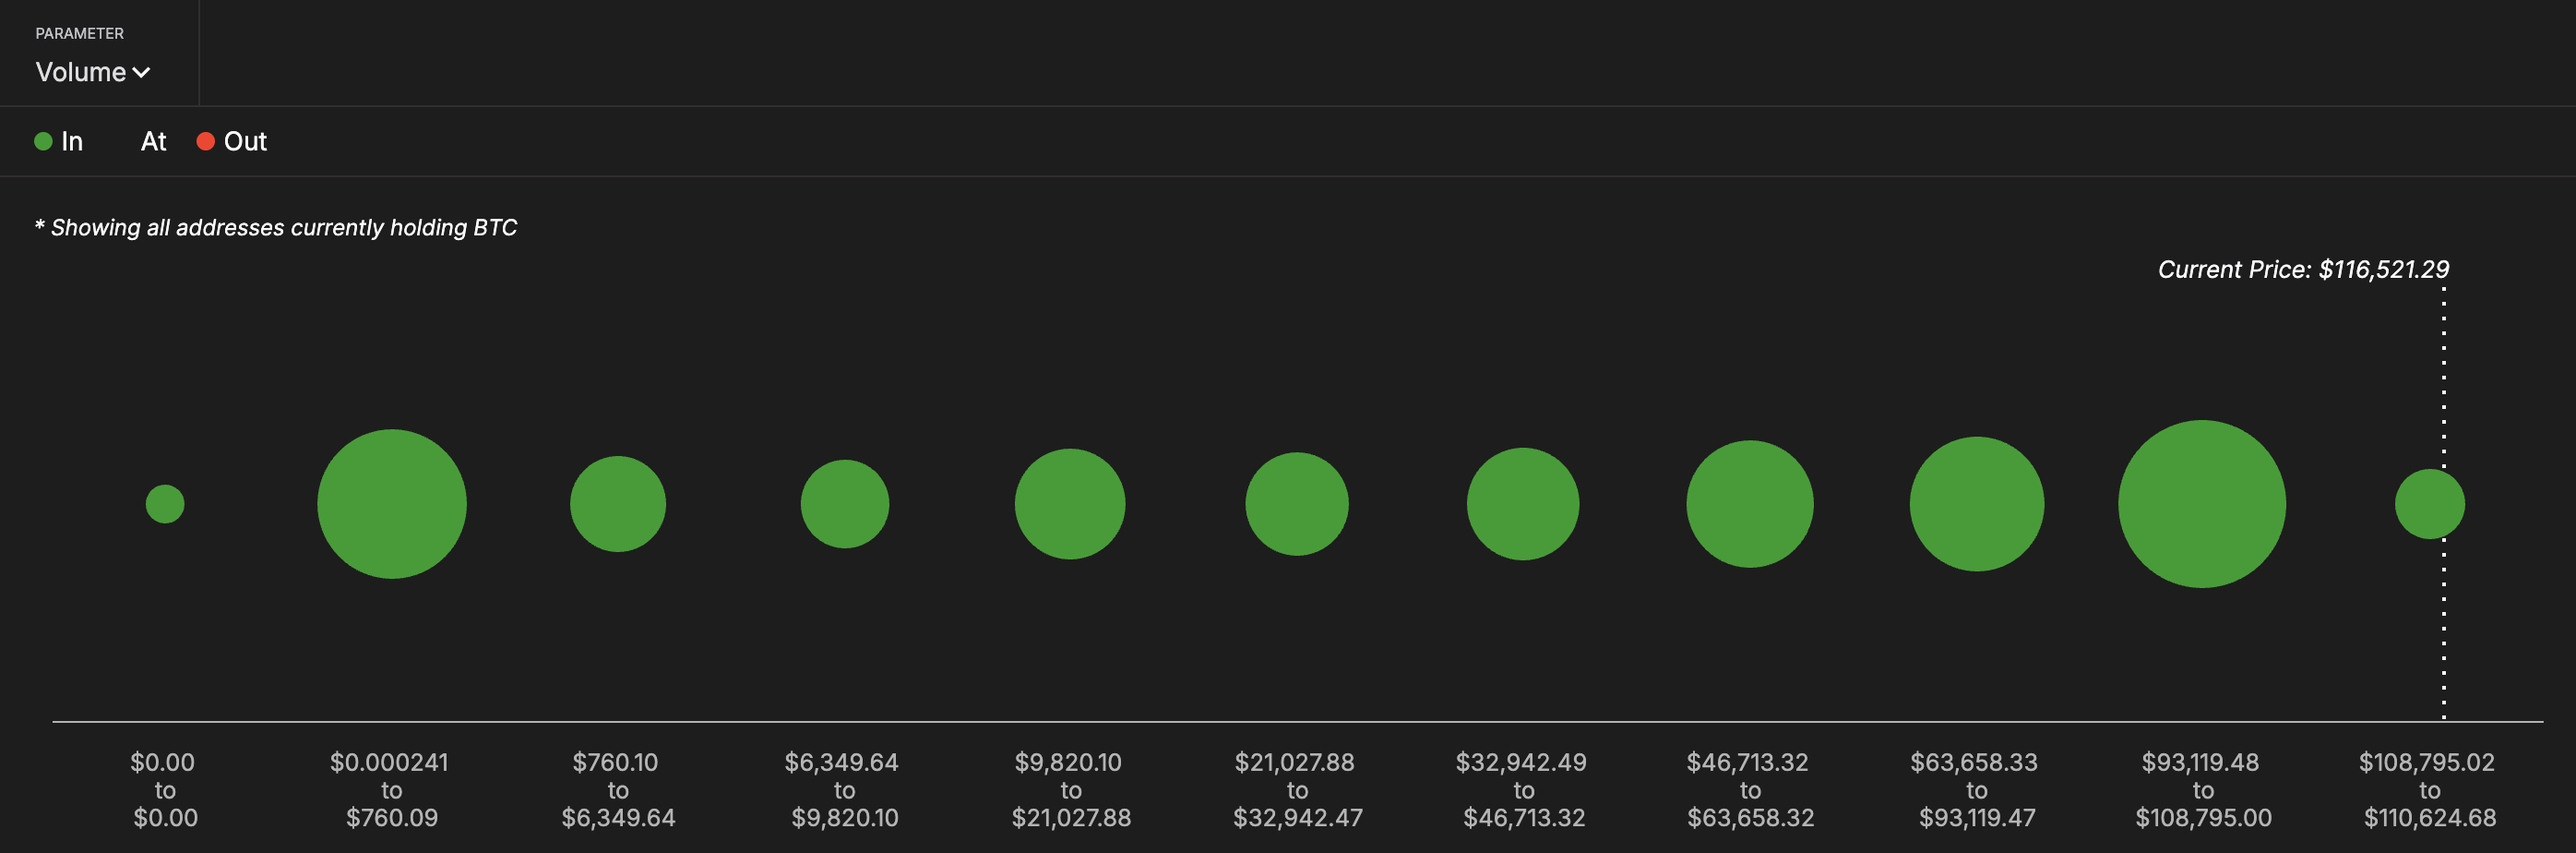
In May, the price collapsed because support zones cracked fast. This time, if bitcoin stays above this address cluster, it means short-term buyers are still in the green. That strengthens conviction.
IOMAP indicates the position of past buyers and whether they are in profit (in the money) or loss (out of the money). When large address clusters overlap with price zones, these areas act as key support or resistance.
RSI Divergence Says “Caution,” But Still No Panic
Here’s the risk. While the BTC price has continued to make higher highs, the Relative Strength Index (RSI) has made lower highs — a textbook bearish divergence. This can often precede a correction.
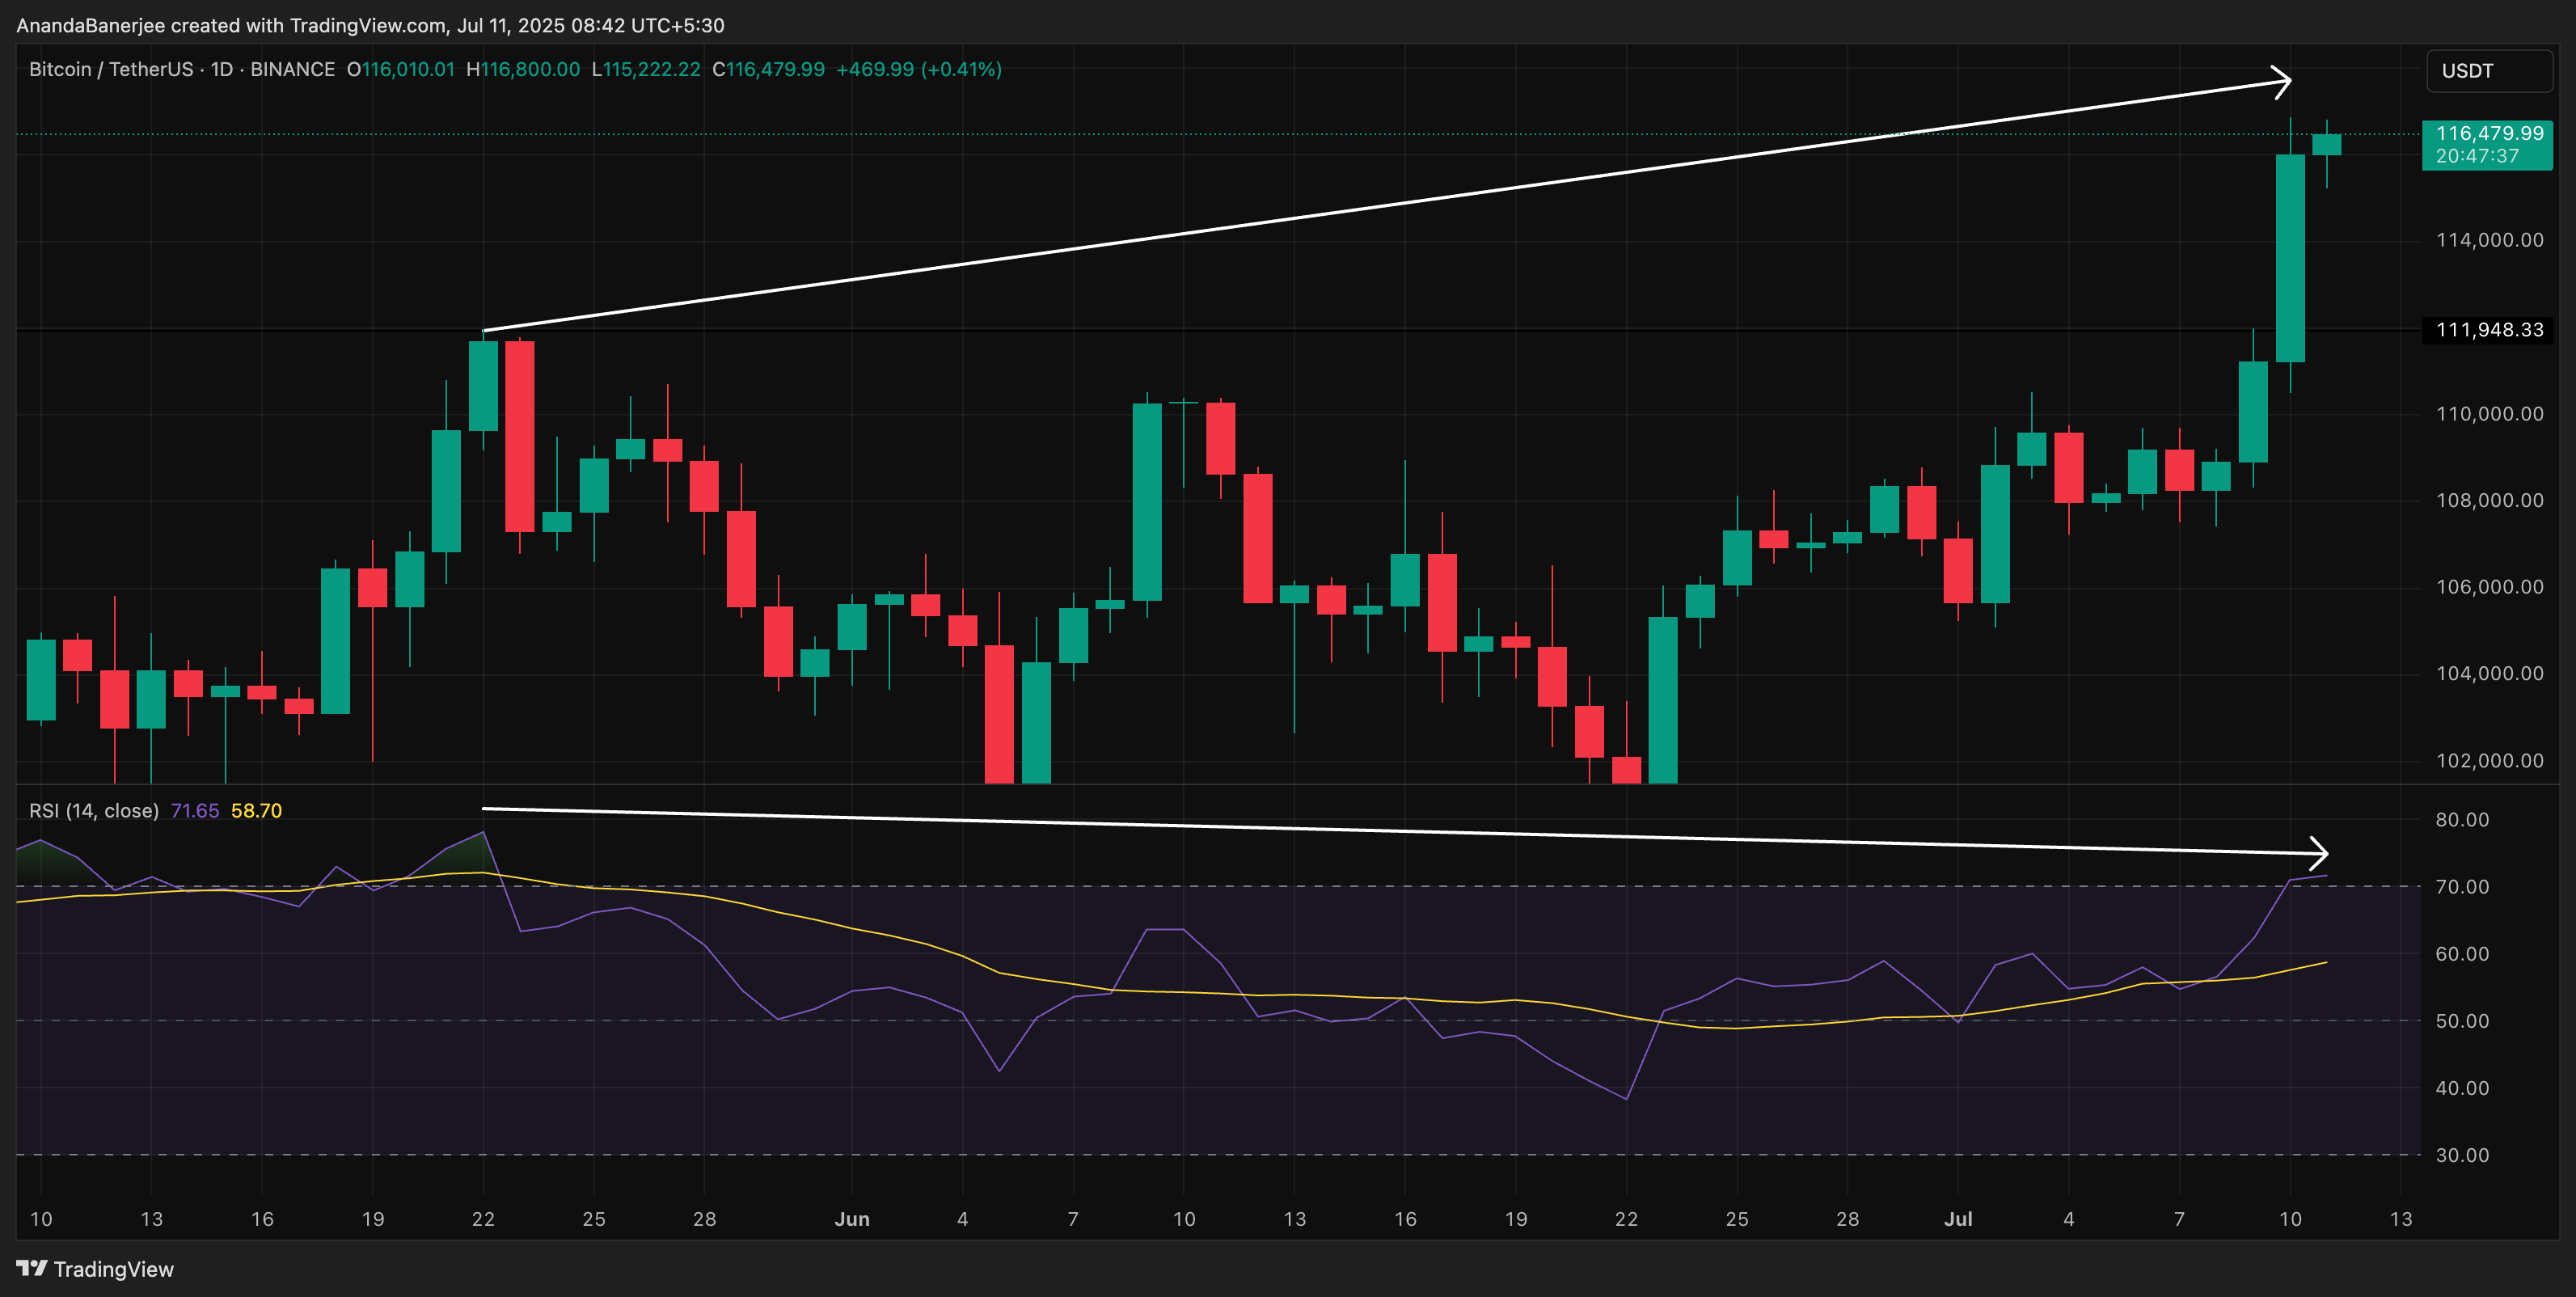
However, RSI remains below the overheated zone (under 72), unlike May when it spiked close to 80. That’s the key difference — the divergence exists, but it hasn’t yet reached panic levels. Therefore, a massive correction looks unlikely, but you might want to expect a retracement.
RSI tracks momentum. A divergence between price and RSI indicates fading conviction. But since it’s not yet overbought, the current uptrend may still have fuel left.
Trend-Based Fibonacci Levels Offer Clear Upside Targets
With BTC entering price discovery again (lack of historical reference lines), trend-based Fibonacci extensions help chart potential resistance.
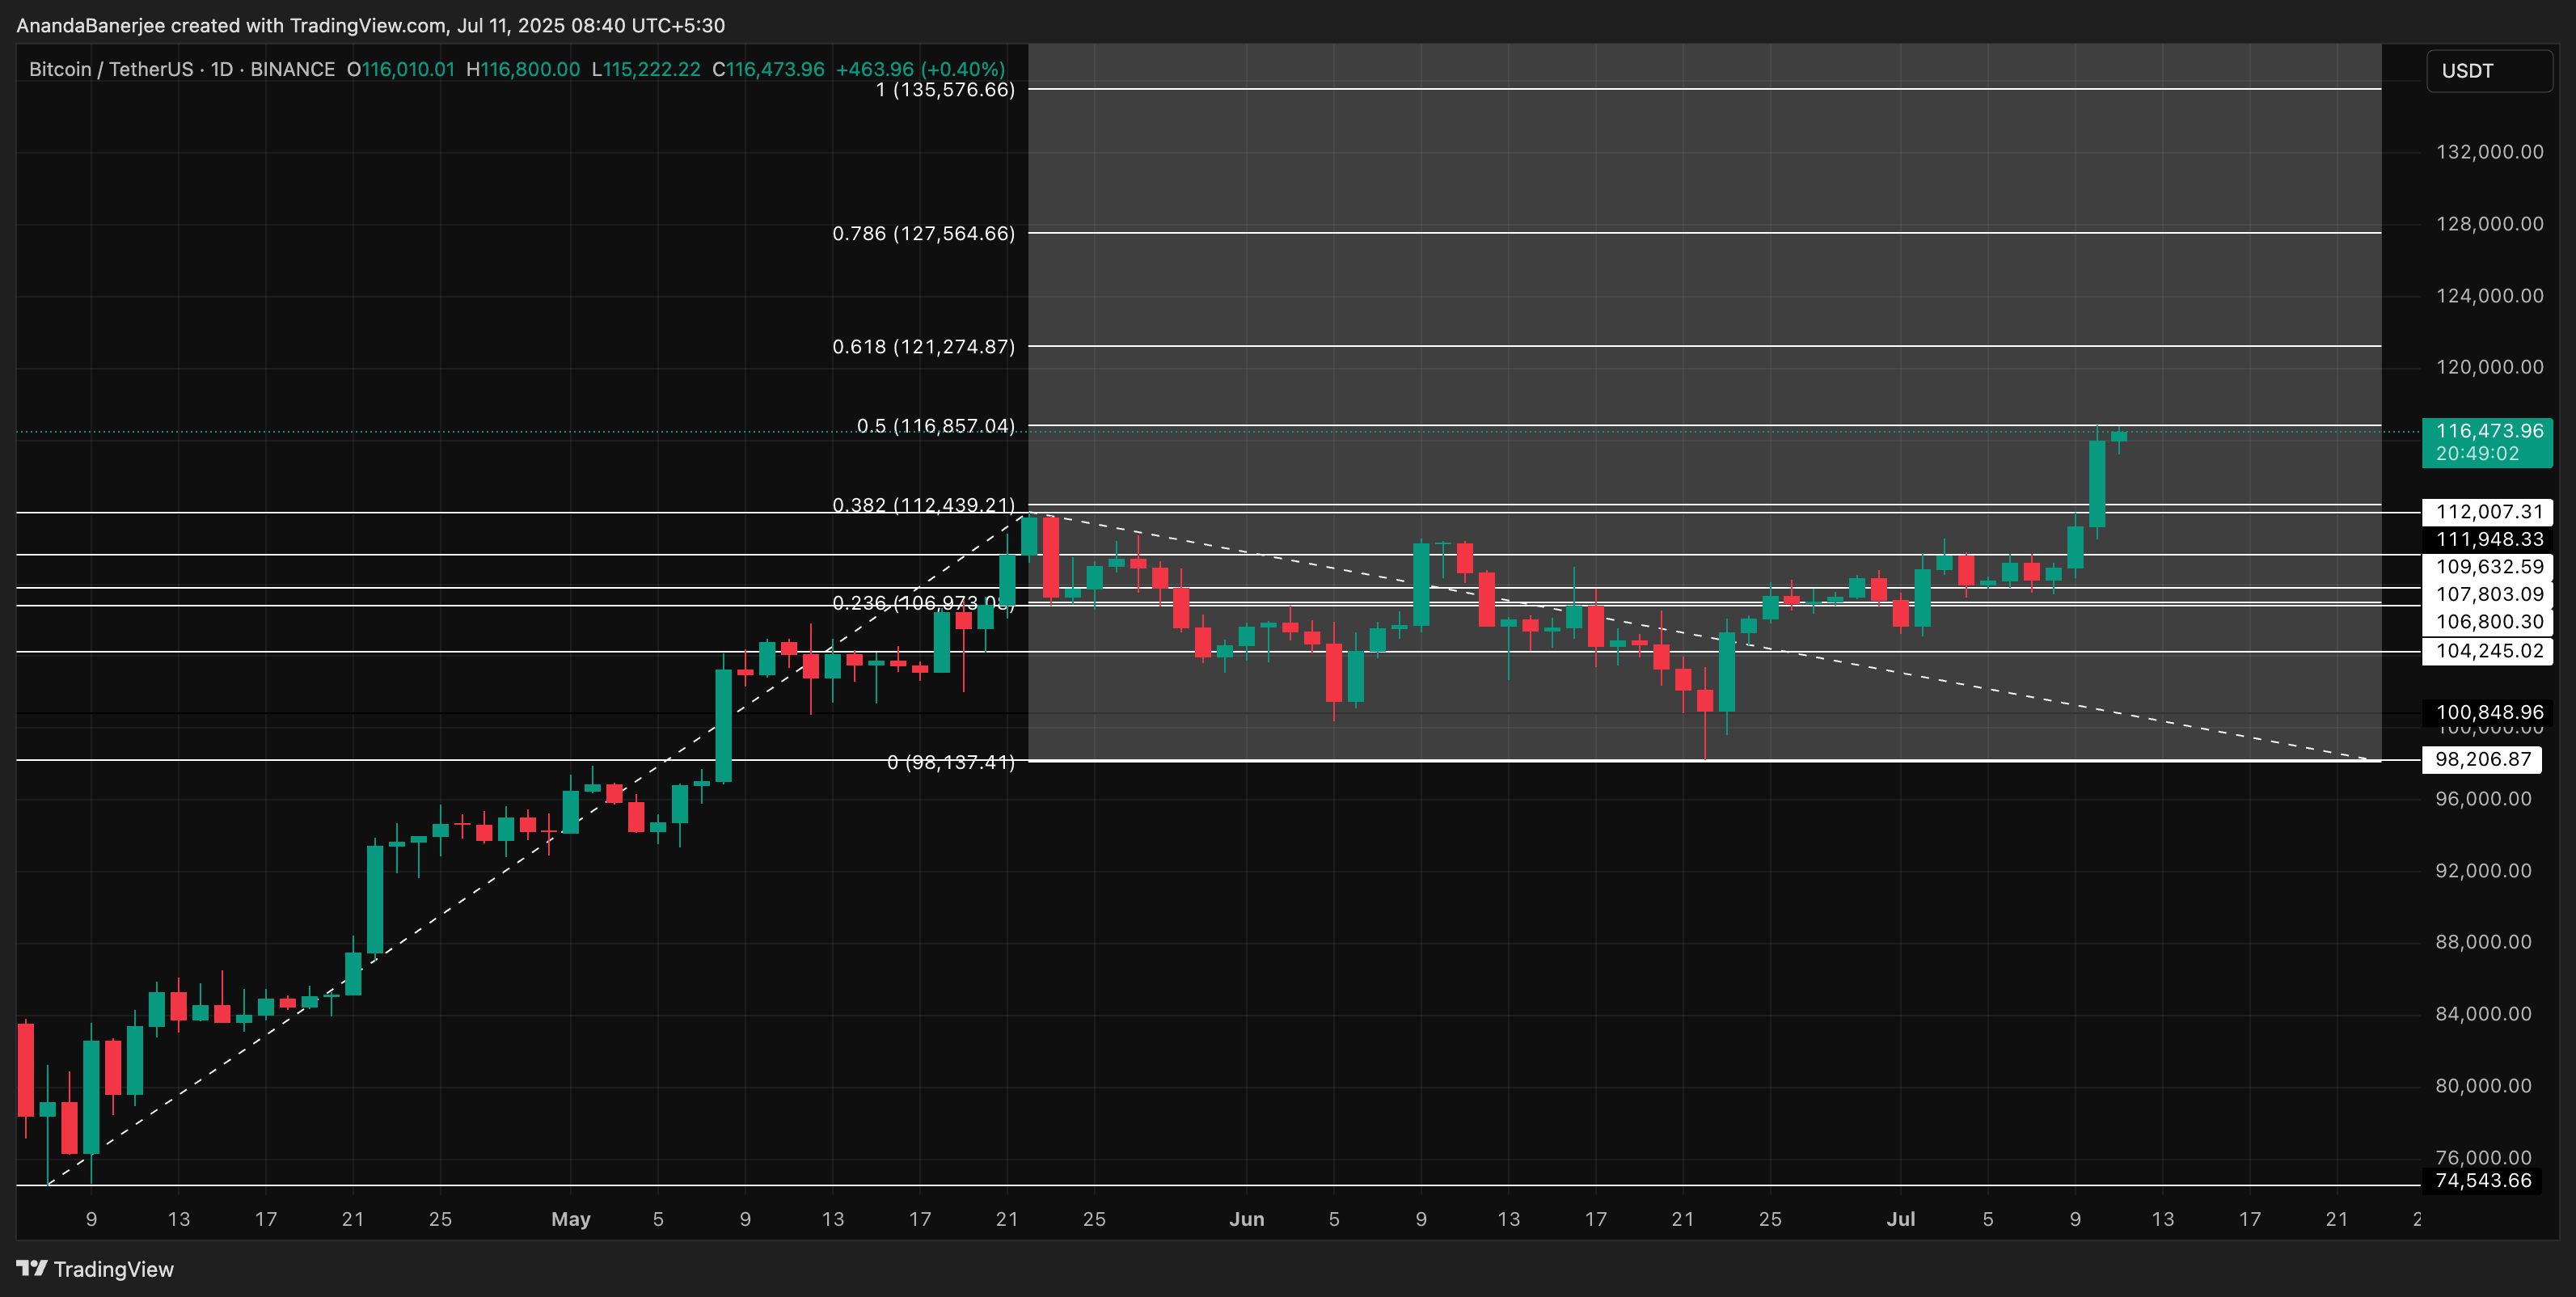
From the swing low of $74,543 to the May high of $111,980, and considering the retracement to $98,000, we get the following resistance levels:
- 0.382 at $112,439
- 0.5 at $116,857
- 0.618 at $121,274
- 1.0 at $135,576
Bitcoin’s latest wick near $116,500 aligns with the 0.5 Fibonacci extension, suggesting that a bitcoin price move beyond this resistance level could open up the path toward $121,000 and $135,000. These levels act as guideposts for continuation, but only if momentum sustains.
Bitcoin is now above its May high, supported by lower sell pressure, clear institutional buying, and strong support clusters. The Fibonacci roadmap suggests room for further upside.
But caution is warranted. RSI divergence has emerged. If price loses momentum below $109,632 (one of the key support levels), this breakout might lead to another May-like retracement, invalidating the bullish hypothesis. Let’s see if Bitcoin can flip this ATH into a sustainable rally.
